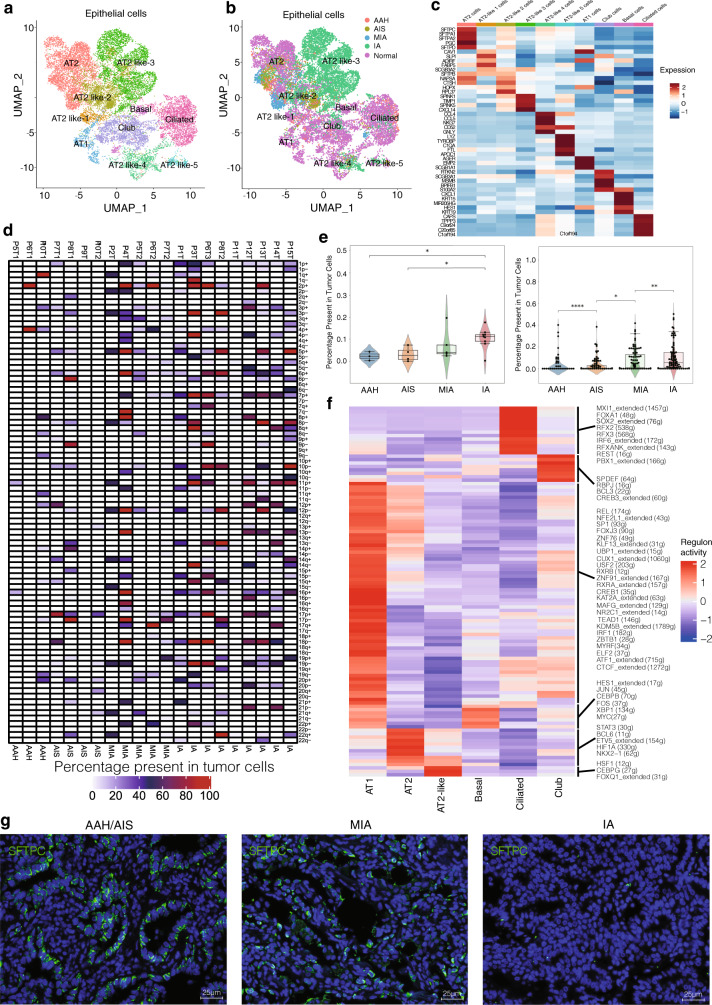
Fig. 2. Characterization of epithelial cell lineages across different stages.
a UMAP visualization of epithelial cell sub-clustering, color-coded by the identified cell subtypes. b UMAP visualization of epithelial cell sub-clustering by histologic stages. c Heatmap of selected marker genes in each cell cluster subtype. d Summary plot of the inferred CNV profiles from each of the 15 patients; CNVs were annotated by the chromosome arm in which the CNV events were calculated. Chromosomal amplification (red) and deletion (blue) were extrapolated in each chromosomal position (columns) across the single cell (rows). The color bar represents the assigned cell-type signature for each cell. e Violin plot of CNV percentage present in tumor cells at different stages. Each dot represents the average CNV (amplification or deletion) percentage in each stage (left) and the CNV events in chromosome arm in each stage (right). Mann–Whitney two-sided test is used to test the significance of CNV levels between different tumor stage categories. (AAH stage: n = 3, AIS: n = 4, MIA stage: n = 5 and IA stage: n = 9; Left: AIS vs IA p-value is 0.0253, AAH vs. IA p-value is 0.0420; Right: AAH vs AIS p-value is 2.898e-05, AIS vs. MIA p-value is 0.0348, MIA vs. IA p-value is 0.00799; *: p < 0.05, **: p < 0.01, ***: p < 0.001, ****: p < 0.0001). f Heatmap of gene expression regulation by transcription factors using SCENIC for the epithelial cells. g Protein fluorescence immunostaining for SFTPC in human tumor samples from the representative tumor stages (i.e., AAH to IA). Each staining in panels come from three samples. Nuclei were stained blue (DAPI). Scale bars: 25 μm. CNV: copy number variation; SCENIC: Single-Cell Regulatory Network Inference and Clustering. Source data are provided as a Source Data file.

