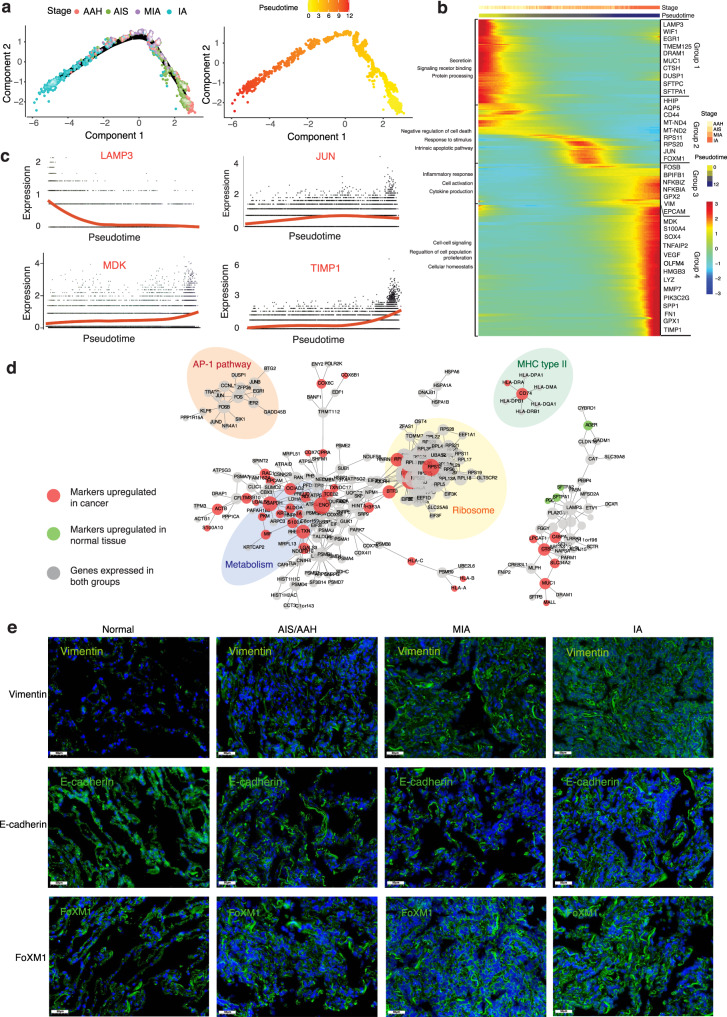
Fig. 3. Transcriptional trajectory analysis of AT2 cells.
a Trajectory analysis of AT2 and AT2-like cell clusters. Cells were color-coded by histologic stages or pseudotime. AT2: alveolar type 2 cells. b Heatmap showing 283 differentially expressed genes arranged in pseudotemporal patterns. Gene Oncology terms from the enrichment analysis revealed biological functions of cells in the four groups indicated. c Representative gene expression levels of different marker genes. The size of each dot represents relative expression levels. d Gene-gene interaction networks between marker genes in AT2 and AT2-like cell clusters. e Fluorescent in situ hybridization staining for Vimentin, E-cadherin, and FoXM1 in normal tissues and tumor tissues from different stages. Each staining in panels come from three samples. Scale bars: 50 μm, nuclei (DAPI) are stained blue.

