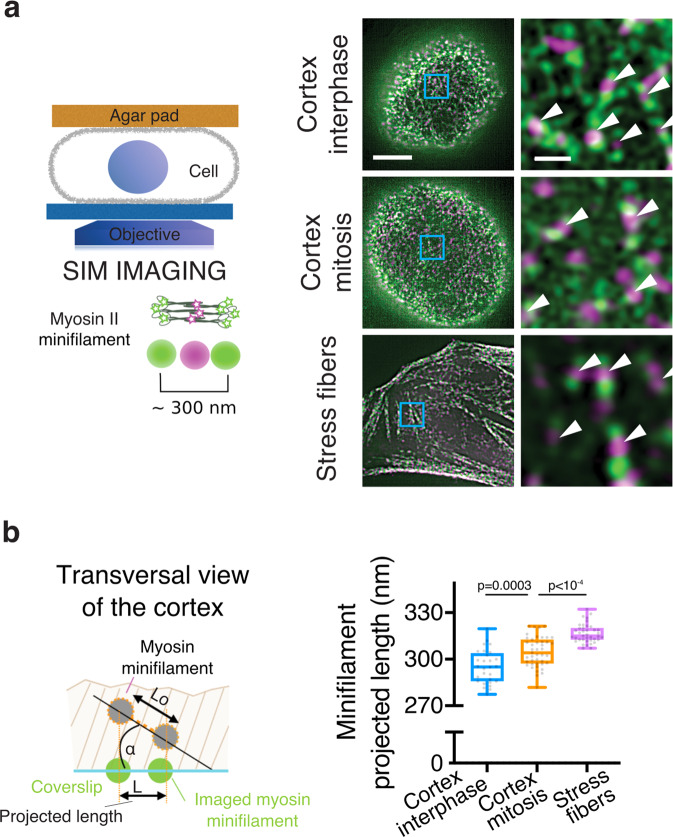
Fig. 1. Changes in myosin minifilament orientation between interphase and mitosis.
a Left: schematic representation of the SIM imaging setup. Cells are compressed under an agar pad, so that a large flat cortical surface can be imaged. Right: representative SIM images of the bottom surface of rounded interphase, mitotic, and spread interphase cells expressing EGFP–NMM HC IIB and NMM HC IIB-tdTom. Arrowheads highlight myosin minifilaments. Scale bars, 5 µm and 0.5 µm. b Left: schematic of the minifilament projected length measurement (see Supplementary Fig. 2 for method). Right: projected lengths of myosin minifilaments in the cortex of rounded interphase and mitotic cells, and in stress fibers in spread interphase cells; n = 28, 43, and 51 cells, and 2, 3, and 2 independent experiments, respectively; 100–500 minifilaments measured per cell. Boxplots show 25th–75th percentiles, the median, and whiskers from minimum to maximum. Statistics: Welch’s t-test (two-tailed). Source data are provided as a Source Data file.

