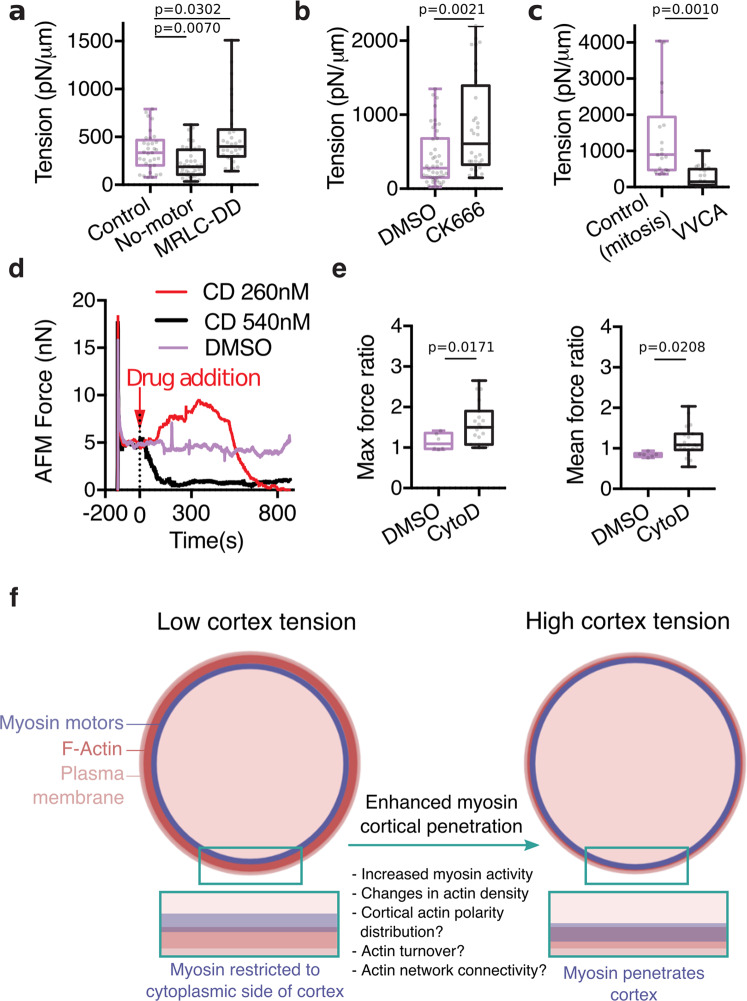
Fig. 4. Changes in cortical tension upon changes in myosin penetration into the cortex.
a–c Cortical tension measurements for a, interphase cells expressing myosin mutants (ΔN592 NMM HCIIA (no motor) and MRLC-DD), b 20 µM CK666 treated interphase cells, and c, mitotic cells expressing VVCA. n = 33, 39, and 30 cells in 2, 3, and 2 independent experiments, respectively, in a, n = 44 and 32 cells in 3 and 2 independent experiments respectively in b and n = 18 and 22 cells in 2 and 2 independent experiments, respectively, in c. d, Example force curves exerted by a compressed rounded interphase HeLa cell on an AFM cantilever (AFM force as a readout of cortical tension) upon addition of DMSO (control) and different doses of CD to the sample. After a force peak upon initial cell compression, the AFM force was first left to relax, until a plateau was reached, DMSO or CD were then added (t = 0 s on graph). Source Data are provided as a Source Data file. e Corresponding quantification of all AFM experiments (performed as described in (d)) showing the maximum and mean AFM forces after addition of DMSO (control) and 260 nM CD to the dish, normalized to the AFM force before treatment. n = 6 and 19 cells, 2 and 4 independent experiments, respectively. f Schematic depicting the possible mechanisms controlling myosin penetration into the actin cortex. All boxplots show 25th–75th percentiles, the median, and whiskers from minimum to maximum. Statistics: Mann–Whitney U test (two-tailed) or Welch’s t-test (two-tailed).

