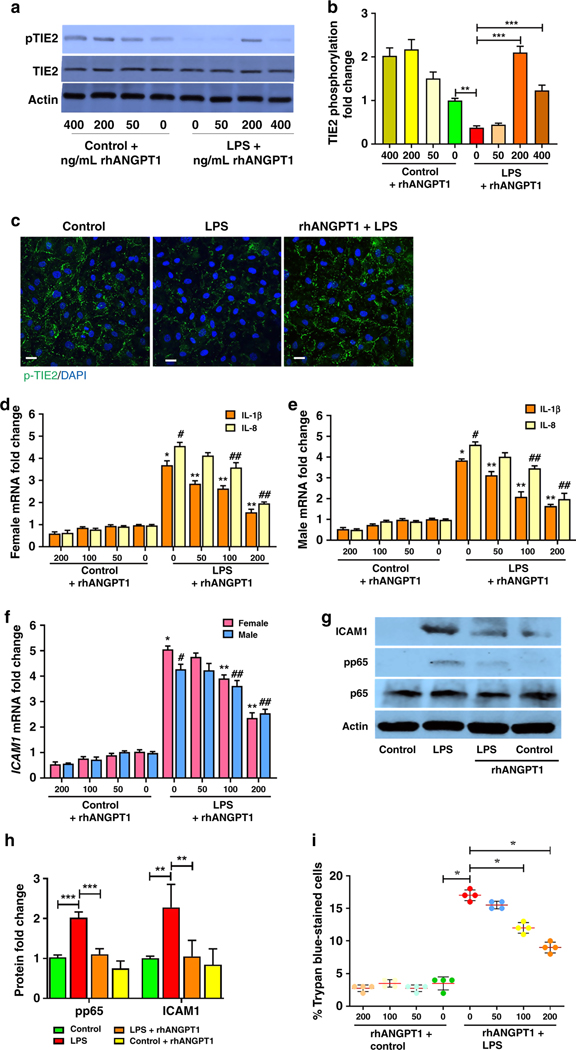
Figure 1– LPS-induced EC activation is suppressed with rhANGPT1 in HPMEC.
(A) HPMEC in culture were treated with LPS (100ng/mL) and rhANGPT1 pre-treatment (1h) at different doses and lysates used for western blotting pTIE2, with quantification by densitometry (B). (n=4/condition, **p<0.01; **p<0.001 between Control and LPS; LPS and LPS+rhANGPT1.) (C) HPMEC grown on coverslips were pre-treated with rhANGPT1 (500ng/mL for 1h) followed by LPS (100ng/mL) for 18h, and then used for pTIE2 (Green) and DAPI (nucleus) immunofluorescence. Scale bar indicates 10μm. (n=3/condition.) (D, E, F) IL-1β, IL-8, and ICAM1 RNA expression was quantified by RT-PCR in male and female HPMEC lysates treated with rhANGPT1 followed by LPS (100ng/mL) for 18h (n=3/sex/condition). (D and E); *p<0.001, **p<0.01 between Control vs. LPS, LPS vs. LPS+rhANGPT1 (IL-1β); #p<0.001, ##p<0.01 between Control vs. LPS, LPS vs. LPS+rhANGPT1 (IL-8). (F) *p<0.001, **p<0.01 between -Control vs. LPS, LPS vs. LPS+rhANGPT1 (Male); #p<0.001, ##p<0.05 between Control vs. LPS, LPS vs. LPS+rhANGPT1 (Female). (G) Immunoblots of ICAM1 and phosphorylated p65 protein from cell lysates 24h post-treatments, with densitometry shown (H). (n=4/condition, **p<0.01, ***p<0.001 between Control and LPS; LPS and LPS+rhANGPT1). ANOVA with post-hoc Tukey or Mann Whitney tests were used. (I) Cell viability by trypan blue assay. x axis denotes rhANGPT1 dose. (n=4/condition, *p<0.05 between Control and LPS; LPS and LPS+rhANGPT1 100 ng/mL; LPS and rhANGPT1 200 ng/mL).

