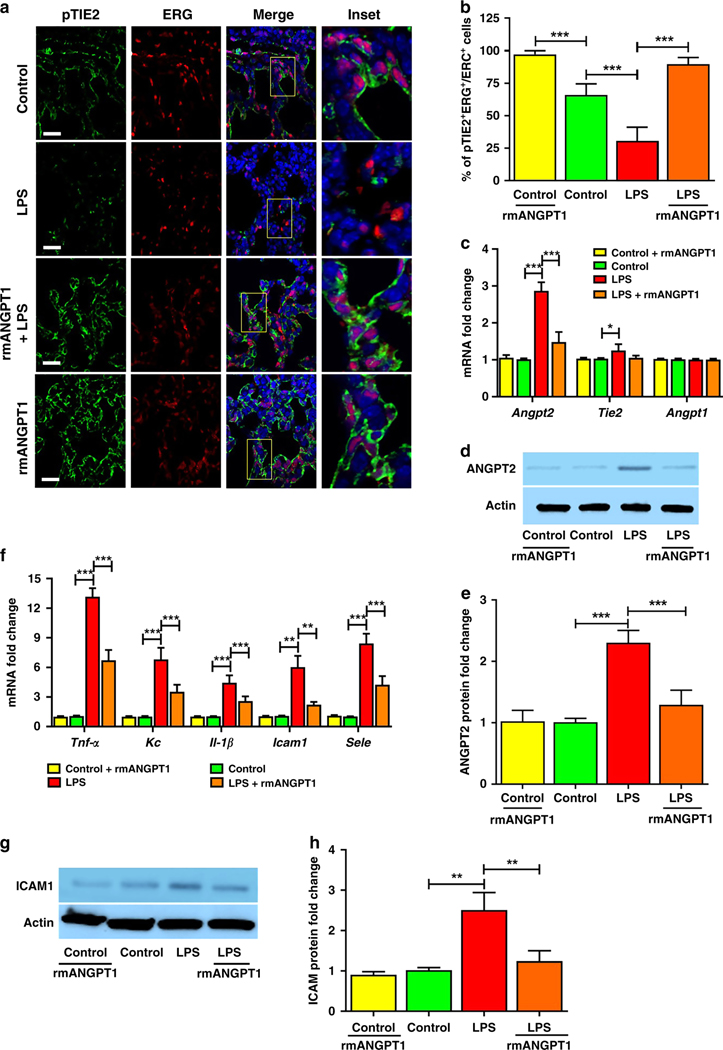
Figure 3– rmANGPT1 restores TIE2 phosphorylation (pTIE2) and suppresses LPS-induced ANGPT2 and inflammation in mice.
6-day-old mice were pre-treated with i.p rmANGPT1 (1μg, 2h), followed by vehicle or LPS (2mg/kg i.p). Lung sections or homogenates obtained after 24h were used for assays. (A) Immunofluorescent staining for pTIE2 (green), ERG (red), and DAPI (blue) in lung sections, with quantification of pTIE2+:ERG+ co-staining per high power field (HPF) shown (B). Scale bar indicates 10μm. (n≥5/condition, ***p<0.001 between Control and Control+rmANGPT1; Control and LPS; LPS and LPS+rmANGPT1.) (C) Whole lung gene expression of Angpt2, Angpt1, and Tie2by qPCR. (n=5/condition, (*p<0.05, ***p<0.001 between Control and LPS; LPS and LPS+rmANGPT1.) (D) ANGPT2 protein by immunoblot, with quantification by densitometry shown (E). (n≥5/condition, ***p<0.001 between Control and LPS; LPS and LPS+rmANGPT1.) (F) Tnf-a, Il-1β, Kc (IL-8), Icam1, and Sele (E-selectin) RNA expression was quantified by qPCR. (n=5/condition, **p<0.01, ***p<0.001 between Control and LPS; LPS and LPS+rmANGPT1.) (G) ICAM1 protein was quantified by immunoblot, with densitometry shown graphically (H). (n≥5/condition, **p<0.01 between Control and LPS; LPS and LPS+rmANGPT1.) ANOVA (with Tukey) or Mann Whitney tests were used.

