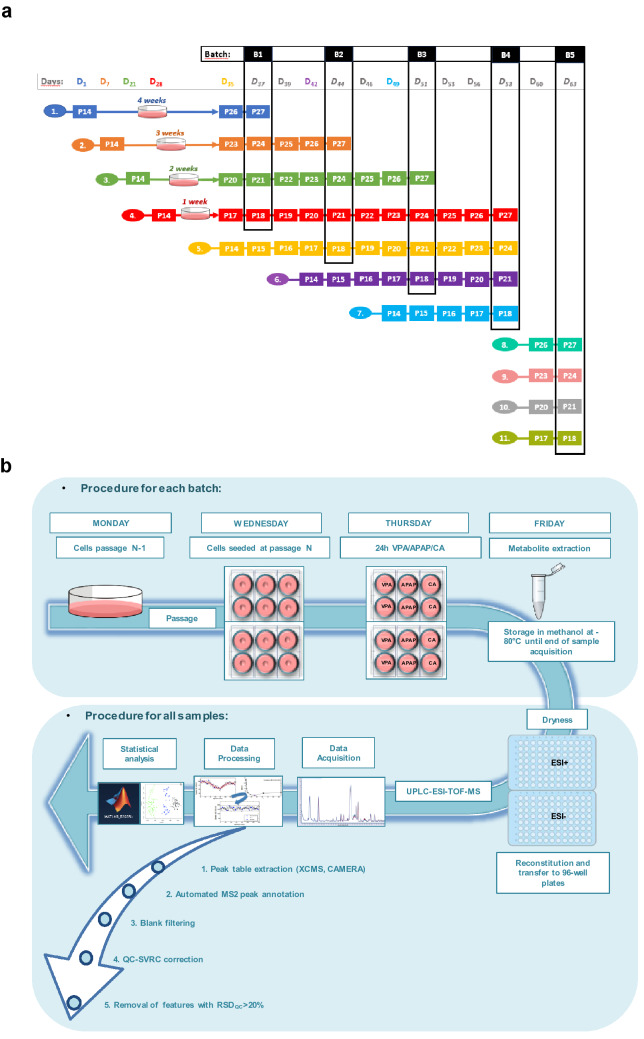
Figure 1.
Experimental design. (a). Timing of the experiment, where D means day and the subindex indicates number of days elapsed since the beginning of the experiment. Processing batches (B1, B2, B3, B4 and B5) are shown in vertical black squares. Each batch was processed within 7 days of difference between each other, except for Batch 5 that was obtained 5 days after Batch 4. Each processing batch includes samples from four different passages (P18, P21, P24 and P27). After cell metabolite extraction, all cell extracts were stored at − 80 °C until final analysis in the UPLC-QqTOFMS. (b) Workflow of the experimental setup. Cells were thawed on day 1, 7, 21, 28, 35, 42 and 49. After subsequent passages, cells were seeded at the desired passage. 24 h later different treatments (CA, VPA and APAP) were independently added to the cells, and after 24 h cell treatment, samples were processed for metabolite extraction. Quadruplicate samples were analyzed for each experimental condition. Cell extracts were stored in methanol at − 80 °C until the end of sample collection. Afterwards, all samples were evaporated, reconstituted, and transferred to the 96-well plates and measured by UPLC-ESI-QqTOFMS on the same day. Data acquired was processed for peak table generation using XCMS and CAMERA software, metabolites were annotated by automated MS2 peak annotation, uninformative features were discarded by blank filtering and QC-SVRC correction and removal of features with RSDQC > 20% was performed. Finally, statistical analysis was carried out for data analysis and interpretation.

