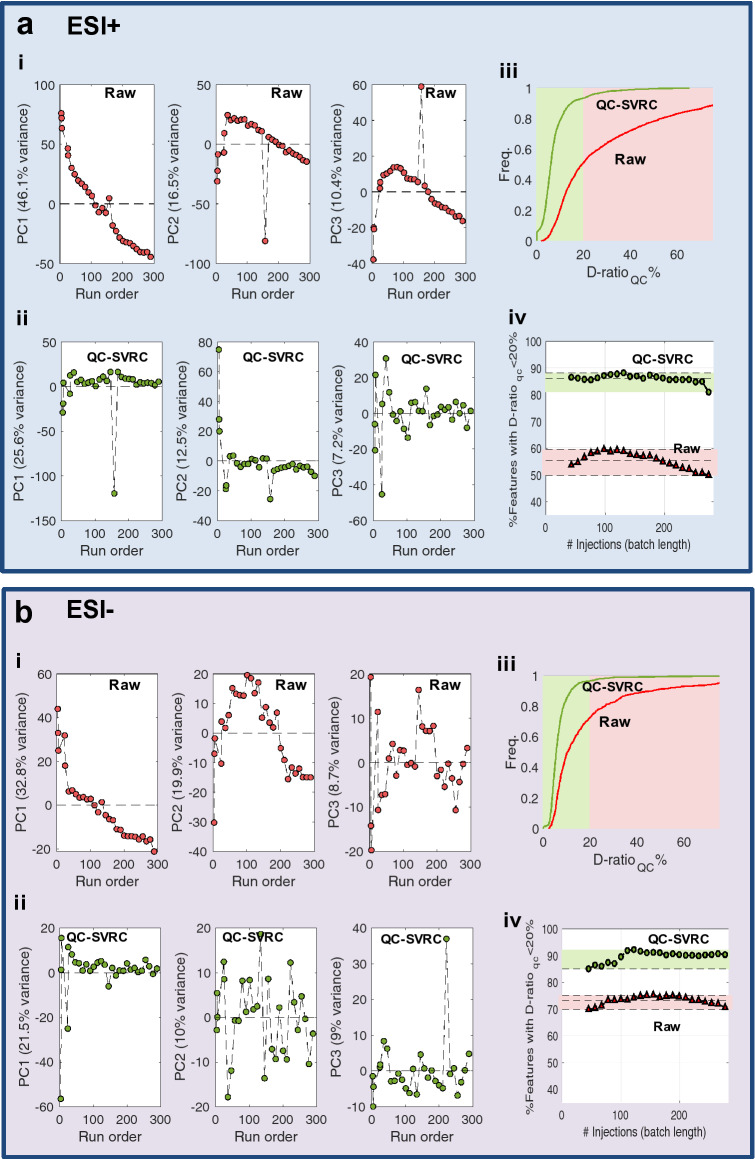
Figure 2.
QC-SVRC correction eliminates within batch effect and improves data quality increasing the percentage of metabolites retained after data pre-processing. Results from ESI+ (a) and ESI− (b). PCA of the QC samples before (i) and after (ii) QC-SVR correction. Plots show the run order versus PC1, PC2 or PC3 and each dot represents a QC sample. The percentage of variance in each component is shown (% variance) (i, ii). Cumulative distribution functions of the D-ratioQC % in the original dataset and after QC-SVRC (iii). Percentage of variables showing a D-ratioQC < 20% in batches with different number of injections (iv).

