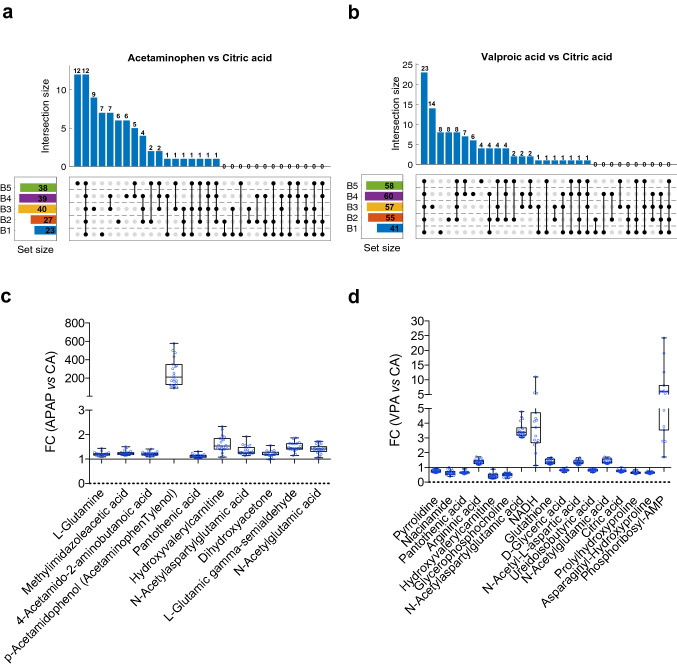
Figure 4.
Analysis of the reproducibility of the metabolic alterations induced by xenobiotics. Upset plots to visualize the intersecting sets of metabolites that appeared statistically significant (p value < 0.05) in the t test analysis between acetaminophen and citric acid (a) or valproate and citric acid (b) from one up to five batches. Numbers on the set size squares indicate the metabolites that are statistically significant between compound comparisons in each batch. (c-d) Box plots of the fold change (FC) in the levels of the metabolites that were statistically significant in the t test between valproate or acetaminophen treatment versus citric acid in all five batches. FC > 1 means metabolite increase and FC < 1 decrease. Each dot represents the FC in a specific batch and passage.

