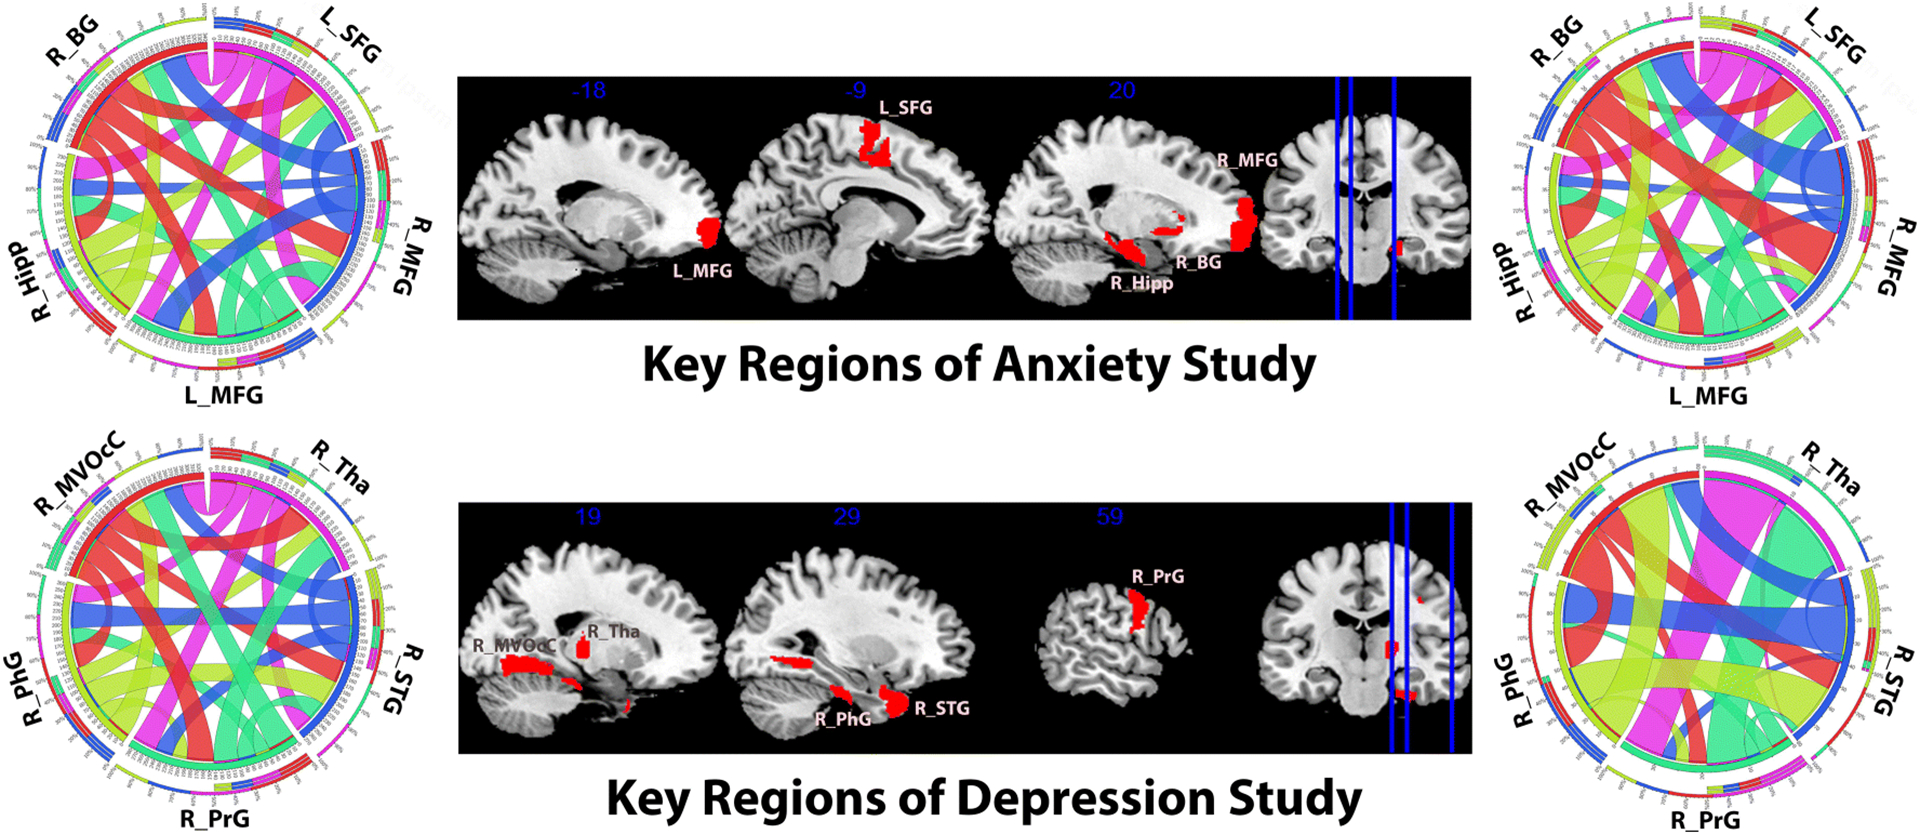
Fig. 5:

Slice view of five key brain regions (middle) and their inter-connection strength visualization. The top row shows results for the anxiety study (Dataset 1) and the second row for the depression study (Dataset 2). On each row, the left circos [43] describes the functional connection network and the right circos describes the structural connection network. In each circos, the arc widths indicate the connection strengths. Abbreviation: left and right middle frontal gyrus (L/R_MFG), left superior frontal gyrus (L_SFG), right basal ganglia (R_BG), hippocampus (R_Hipp), superior temporal gyrus (R_STG), parahippocampal gyrus (R_PhG), Thalamus (R_Tha), medioventral occipital cortex (R_MVOcC) and precentral gyrus (R_PrG).
