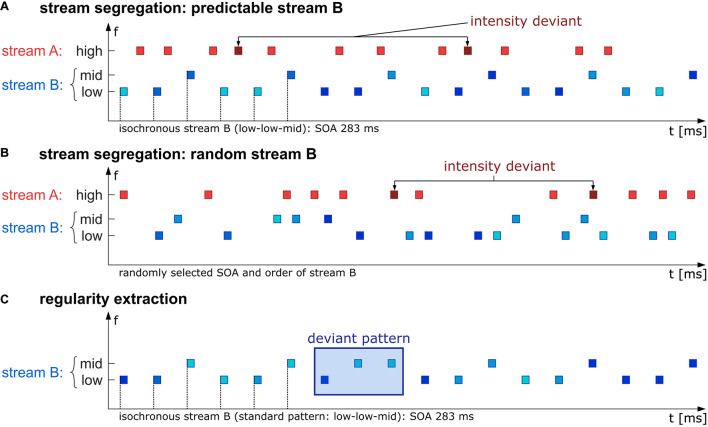
FIGURE 1.
Schematic illustration of the stimulus paradigm. In the first experimental part, participants were instructed to detect intensity deviants (probability in sequence 10%, deviants are 10 dB higher in level than standards) in a high-frequency stream A (red rectangles). The task-irrelevant stream B (blue rectangles) was presented in either an isochronous (SOA 283 ms) and therefore predictable low-low-mid pattern (A) or random in the chosen SOA (160, 270, or 420 ms) and frequency (either low or mid, B). The second experimental part was a passive listening condition in which just the B stream was presented (isochronous, SOA 283 ms) containing standard low-low-mid triplets which were rarely interrupted by a deviant low-mid-mid triplet with probability of 17% (C). SPL levels in stream B across all conditions (A–C) varied between 55 and 75 dB illustrated by different blue hues.

