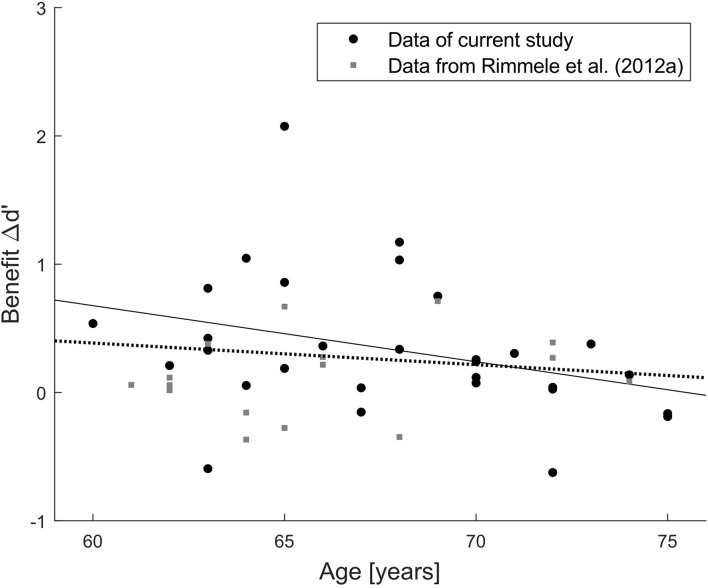
FIGURE 6.
Post hoc joint analysis of two independent participant samples. Scatterplot of the relation between age and benefit Δd’ for performance in the predictable/isochronous minus random condition. Each dot refers to one individual data point (black dots: current study, gray squares: Exp. 2 in Rimmele et al., 2012a). Solid line indicates correlation in the current study (r = –0.33, p = 0.07, N = 30), dotted line indicates correlation in the combined data (r = –0.14, p = 0.34, N = 46).

