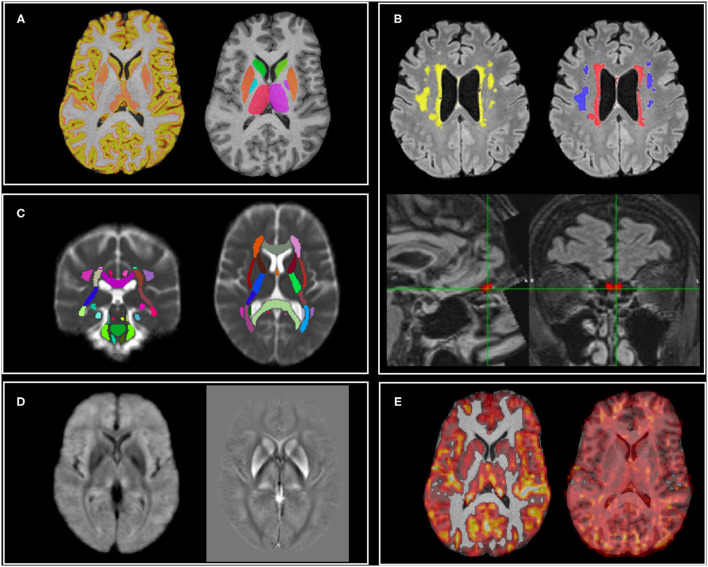
Figure 1.
MRI modalities and examples of outputs of the analysis pipeline. (A) T1: cortical volumes (left—GM partial volume estimate shown as example) and subcortical volumes (right); (B) T2-FLAIR: white matter hyperintensities (total in yellow, periventricular in red, deep in blue) and olfactory bulb volume and intensity; (C) dMRI: mean diffusivity of major white matter tracts (average MD image across subjects shown for display purposes); (D) Susceptibility weighted imaging (average images across subjects shown for display purposes): (left) and QSM (right); (E) ASL: non-partial volume corrected cerebral blood flow (left—lower threshold set to 20 ml/100 g/min for display purposes) and arterial transit time (right).

