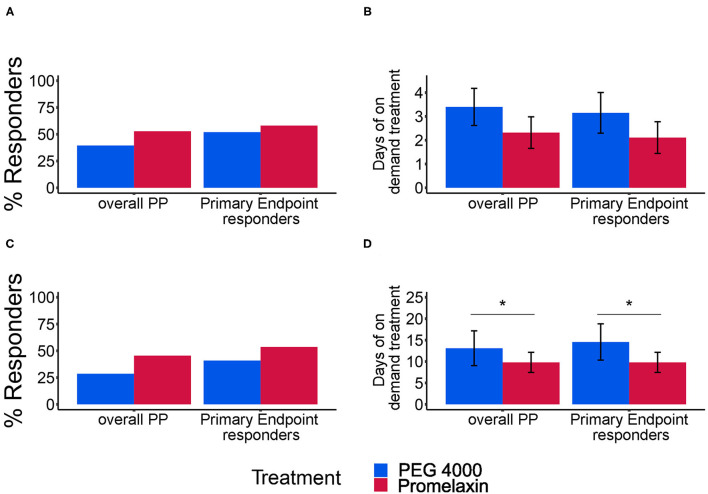
Figure 4.
Response rate for combined stool frequency and consistency and average days of treatment. (A,C) show the response rate (%) for the combined stool frequency and consistency secondary endpoints at V4 and V5, respectively. (B,D) show the average days of treatment (mean ± SE) at V4 and V5, respectively. In each panel, results of separate analyses either according to the PP population or to the subgroup of PP patients evaluated as responders to the primary endpoint (Primary Endpoint Responders) are depicted. Error bars represent Standard Error. (A) Overall PP: PEG, n = 38; Promelaxin, n = 36; Primary Endpoint responders: PEG, n = 25; Promelaxin, n = 31. (B) Overall PP: PEG, n = 15; Promelaxin, n = 19; Primary Endpoint responders: PEG, n = 13; Promelaxin, n = 18. (C) Overall PP: PEG, n = 35; Promelaxin, n = 33; Primary Endpoint responders: PEG, n = 22; Promelaxin, n = 28. (D) Overall PP: PEG, n = 10; Promelaxin, n = 15; Primary Endpoint responders: PEG, n = 9; Promelaxin, n = 15. *p < 0.05.

