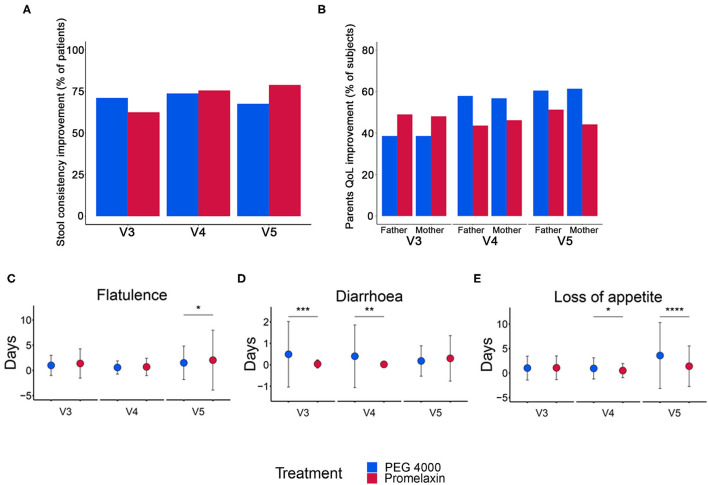
Figure 5.
Stool consistency, QoL improvement and gastrointestinal symptoms in the randomized arms. (A) Percentage of patients with improved stool consistency at V3, V4, and V5. (B) Percentage of parents with improved QoL at V3, V4, and V5. (C–E) Number of days (mean ± SD) with gastrointestinal symptoms at V3, V4, and V5. Data are reported as mean ± SD. *p < 0.05, **p < 0.01, ***p < 0.001, and ****p < 0.0001. (A) V3: PEG, n = 45; Promelaxin, n = 56; V4: PEG, n = 42; Promelaxin, n = 45; V5: PEG, n = 37; Promelaxin, n = 38; (B) V3 (Father): PEG, n = 44; Promelaxin, n = 49. V4 (Father): PEG, n = 38; Promelaxin, n = 39. V5 (Father). PEG, n = 38; Promelaxin, n = 39; (B) V3 (Mother): PEG, n = 44; Promelaxin, n = 52. V4 (Mother): PEG, n = 44; Promelaxin, n = 52. V5 (Mother): PEG, n = 44; Promelaxin, n = 52. (C–E) V3: PEG, n = 45; Promelaxin, n = 56. V4: PEG, n = 40; Promelaxin, n = 47. V5: PEG, n = 40; Promelaxin, n = 47.

