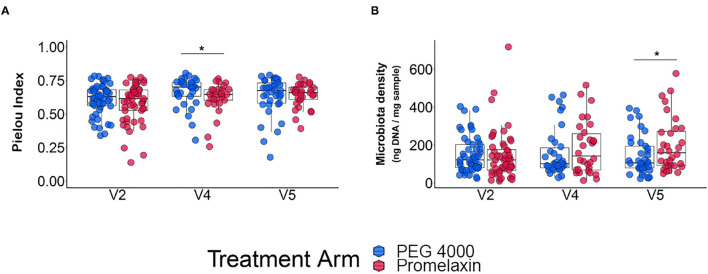
Figure 6.
Microbiota analysis. The figure shows individual data and box-plots as median and IQR. (A) Microbiota evenness. (B) Microbiota density. Kruskal-Wallis-test and Student T-test were used for testing differences in microbiota evenness (Pielou's index) and microbiota density, respectively. *p < 0.05.

