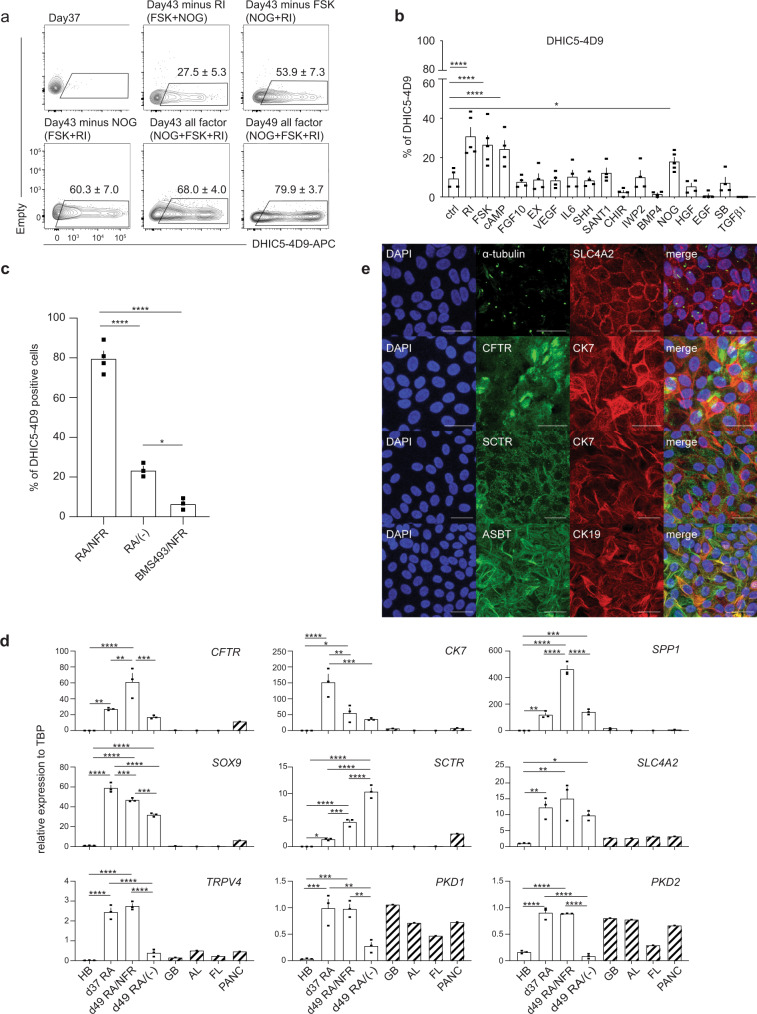
Fig. 2. FSK, NOG, and RI promote the generation of DHIC5-4D9 positive cells.
a Flow cytometry analysis showing the proportion of DHIC5-4D9+ cells at day 37, day 43, and day 49. All factor represents addition of Noggin, Forskolin and Rho-Kinase inhibitor (NFR) following RA treatment. Minus represents withdrawal of each representative factor from NFR for 6 days. Data are represented as mean ± SEM (n = 3–5). b % Positivity of DHIC5-4D9+ cells after 6 days in the presence of factors. *p ≤ 0.05, ****p ≤ 0.0001 two-tailed Student’s t test compared to control. Data are represented as mean ± SEM (n = 5 biologically independent samples from RI, FSK, NOG, n = 4 biologically independent samples per group from the rest). c Quantification of DHIC5-4D9 positive cells in day 49 hPSC-derived cholangiocytes after treatment with different indicated cytokine/small molecule combinations. *p ≤ 0.05, ****p ≤ 0.0001 one-way ANOVA. Data are represented as mean ± SEM (n = 4 biologically independent samples from RA/NFR, n = 3 biologically independent samples per group from the rest). d RT-qPCR analysis of the expression of the indicated gene in each population at different stages of H9-derived cholangiocytes. HB hepatoblast, GB gall bladder, AL adult liver, FL fetal liver, PANC pancreas. *p ≤ 0.05, **p ≤ 0.01, ***p ≤ 0.001, ****p ≤ 0.0001 one-way ANOVA. Data are represented as mean ± SEM (n = 3). e Immunostaining analysis showing the proportion of acetylated α-tubulin and SLC4A2 (top), CFTR and CK7 (second row from the top), SCTR and CK7 (third from the top), ASBT and CK19 (bottom) cells in day 49 cholangiocyte. Scale bar represents 25 μm.

