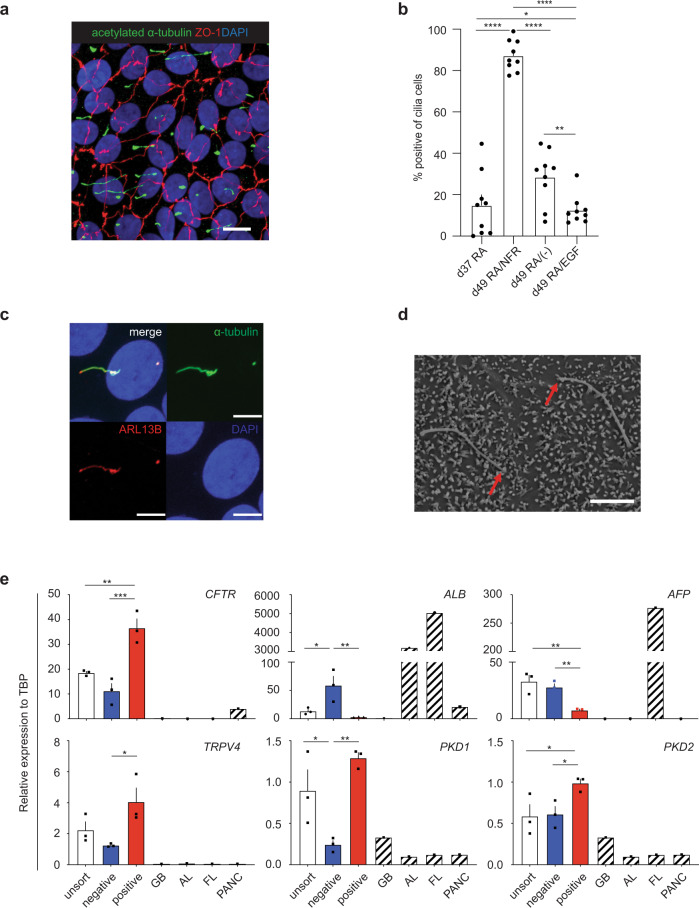
Fig. 3. DHIC5-4D9 positive cells show primary cilia, a characteristic feature of cholangiocyte.
a Confocal microscopy analysis showing co-expression of acetylated α-tubulin and ZO1 in day 49 cholangiocyte. Scale bar represents 10 μm. b Quantification of cilia positive cells in day 37 (after RA) and day 49 hPSC-derived cholangiocytes after treatment with different indicated cytokine molecule combinations. *p ≤ 0.05, **p ≤ 0.01, ****p ≤ 0.0001 one-way ANOVA. Data are represented as mean ± SEM (n = 3). c High magnification image with confocal microscopy demonstrating co-localization of ARL13B with acetylated-α-tubulin (+) primary cilia. Scale bar represents 5 μm. d Scanning electron microscope image of primary cilia and microvilli in 2 cholangiocytes. Red arrows indicate the tips of cilia. Scale bar represents 5 μm. e qPCR analysis for indicated genes in flow-based sorting fractions of DHIC5-4D9+ cells in day 49 cholangiocyte. GB gall bladder, AL adult liver, FL fetal liver, PANC pancreas. *p ≤ 0.05, **p ≤ 0.01, ***p ≤ 0.001 one-way ANOVA. Data are represented as mean ± SEM (n = 3).

