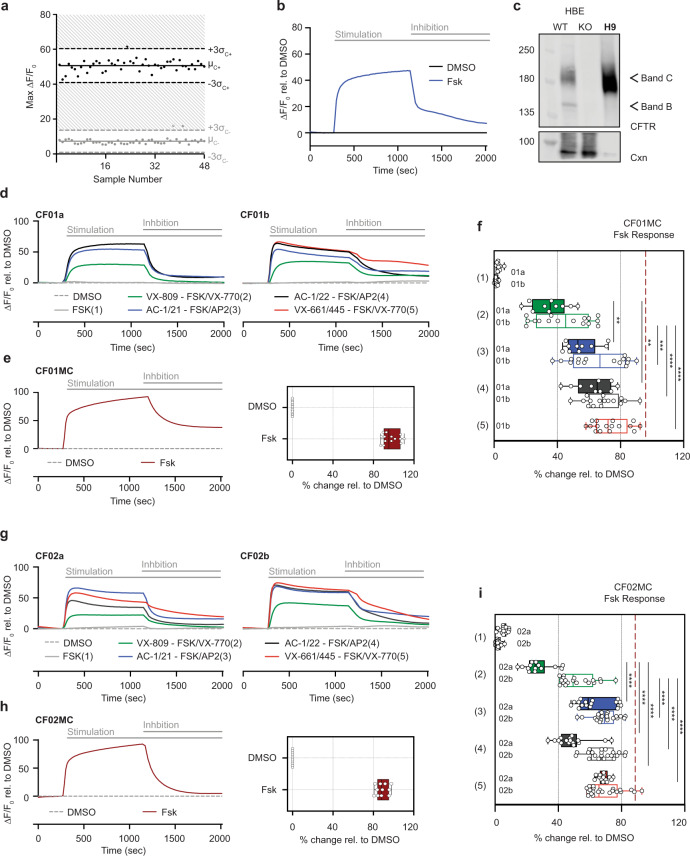
Fig. 4. CFTR Modulator profiling of CF patient-derived cholangiocytes in 96-well monolayer culture.
a The Z factors show the quality of the FLIPR assay measuring Apical Chloride Conductance (ACC) in 96-well plate with hPSC-derived cholangiocytes at day 49. b The kinetics of ACC by FLIPR assay in H9-derived cholangiocytes at day 49. c Western blotting shows the mature glycosylated CFTR band in day 49 H9 cholangiocyte along with the controls from CFTR expressing human bronchial epithelial HBE cell line (WT wild type, KO CFTR knock out). CNX calnexin control. Uncropped blots in Source Data. d The kinetics of ACC by FLIPR assay among different drug treatment in CF01a (left) and CF01b (right) iPSC-derived cholangiocytes. e The kinetics of ACC by FLIPR assay in CF01MC iPSC-derived cholangiocytes (left). Representative % value of CFTR channel activity with an exposure of DMSO and FSK in CF01MC iPSC-derived cholangiocytes normalized to DMSO (n = 4, right). f Representative % value of CFTR channel activity with an exposure of DMSO and CFTR modulators in CF01 iPSC-derived cholangiocytes normalized to DMSO. Dashed line indicates FSK response in CF01MC-derived cholangiocytes. Solid and open boxes represent clone a and b respectively. Stars show statistical significance to VX809/VX770, one-way ANOVA (CF01a n = 3, CF01b n = 4). g The kinetics of ACC by FLIPR assay among different drug treatment in CF02a (left) and CF02b (right) iPSC-derived cholangiocytes. h The kinetics of ACC by FLIPR assay in CF02MC iPSC-derived cholangiocytes (left). Representative % value of CFTR channel activity with an exposure of DMSO and FSK in CF02MC iPSC-derived cholangiocytes normalized to DMSO (n = 4, right). i Representative % value of CFTR channel activity with an exposure of DMSO and CFTR modulators in CF02 iPSC-derived cholangiocytes normalized to DMSO. Dashed line indicates FSK response in CF02MC-derived cholangiocytes. Solid and open boxes represent clone a and b respectively. Stars show statistical significance to VX809/VX770, one-way ANOVA (CF02a n = 4, CF02b n = 4). *p ≤ 0.05, **p ≤ 0.01,***p ≤ 0.001, ****p ≤ 0.0001, (Median ± SEM), Box plots include median line and IQR ranges at the box bounds with the whiskers defining the minima and maxima data points.

