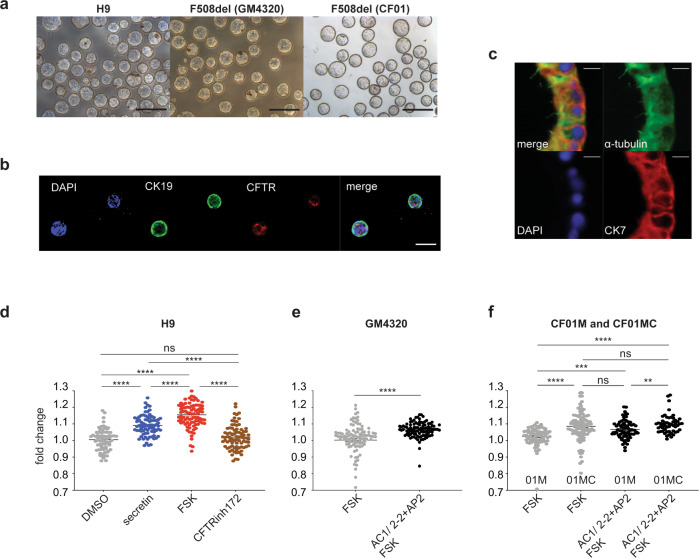
Fig. 5. 3D cholangiocytes cyst/organoids show CFTR function and modeling of CFLD.
a Photomicrographs of cyst/organoid structures that develop in liquid culture condition from monolayer hPSC-derived cholangiocytes. Scale bar represents 500 μm. b Microscopic analysis showing the co-expression of CK19 (green) and CFTR (red) in H9-derived cholangiocyte cysts. Scale bar represents 100 μm. c Immunostaining analysis showing the co-expression of acetylated-α-tubulin (green) and CK7 (red) in H9-derived cholangiocyte cysts. Scale bar represents 10 μm. d Quantification of the degree of H9-derived 3D cholangiocyte cyst swelling 1 h after DMSO and secretin. FSK stimulation in the absence or presence of CFTR inhibitor CFTR Inh-172. ****p ≤ 0.0001 one-way ANOVA (n = 4 biologically independent experiments from DMSO and secretin, n = 3 biologically independent experiments from FSK and CFTRinh172). e Quantification of the degree of F508del (GM4320)-derived 3D cholangiocyte cyst swelling 1 h after FSK stimulation in the presence of DMSO or CFTR modulators. ****p ≤ 0.0001 two-tailed Student’s t test (n = 3). f Quantification of the degree of F508del (CF01) or corrected F508del (CF01MC)-derived 3D cholangiocyte cyst swelling 1 h after FSK stimulation in the presence of DMSO or CFTR modulators. **p ≤ 0.01, ***p ≤ 0.001, ****p ≤ 0.0001, one-way ANOVA (n = 3). Data are represented as mean ± SEM. Each dot represents cyst and n = 15–40 cysts were measured per microwell.

