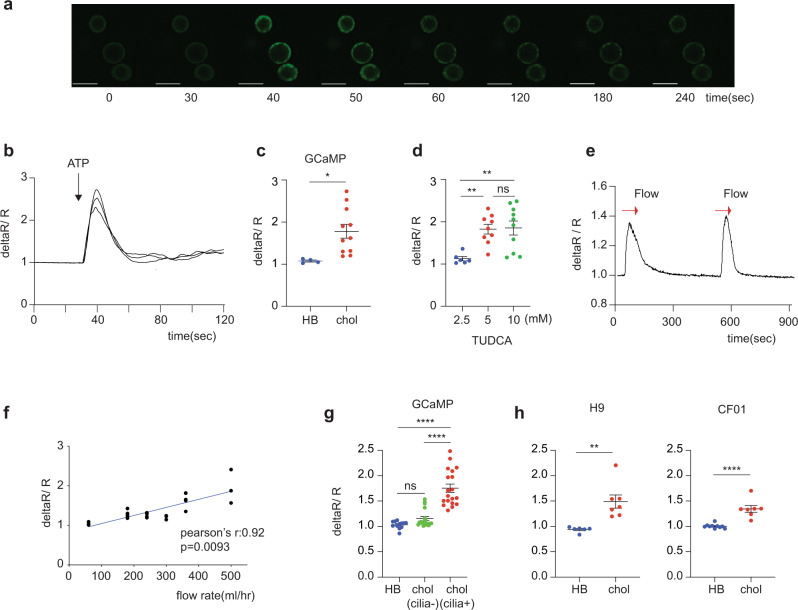
Fig. 6. Intracellular Calcium release in ciliated hPSCs derived cholangiocyte.
a Representative time lapse image of calcium influx in GCaMP hES derived cholangiocyte cyst (3D) in response to ATP. Scale bar represents 200 μm. b Representative traces from Fig. 6a showing the intra cellular calcium release in GCaMP hESC-derived cholangiocytes in the response to ATP. c Quantification of maximum fluorescent intensity representing intra cellular Ca2+ release in GCaMP hESC-derived hepatoblasts (HB) and cholangiocytes (chol) in the response to ATP, *p ≤ 0.05 two-tailed Student’s t test (n = 4 biologically independent samples from HB, n = 3 biologically independent samples from chol). d Quantification of maximum fluorescent intensity representing intra cellular Ca2+ release in GCaMP hESC-derived cholangiocytes in the response to different concentrations of TUDCA, **p ≤ 0.01, one-way ANOVA (n = 3 biologically independent experiments per each concentration). Data are represented as mean ± SEM. e Representative trace of the intra cellular calcium release in GCaMP hESC-derived cholangiocytes induced by flow in the absence of ATP. f Quantification of maximum fluorescent intensity in GCaMP hESC-CF01derived cholangiocytes with increased flow rate (n = 3). Two-tailed pearson correlation coefficient was calculated by Prism8. g Quantification of maximum fluorescent intensity representing intra cellular Ca2+ release in indicated GCaMP derived hepatoblasts (HB), non-ciliated cholangiocyte (cilia-), and ciliated cholangiocytes (cilia + ) in the response to flow, ****p ≤ 0.0001 one-way ANOVA (n = 3 biologically independent experiments per each group). h Quantification of maximum fluorescent intensity representing intra cellular Ca2+ release in indicated hPSC-derived hepatoblasts (HB) and cholangiocytes (chol) in the response to flow, **p ≤ 0.01, ****p ≤ 0.0001 two-tailed Student’s t test (n = 3 biologically independent experiments per each group). Each circle represents the structure measured for intracellular calcium release.

