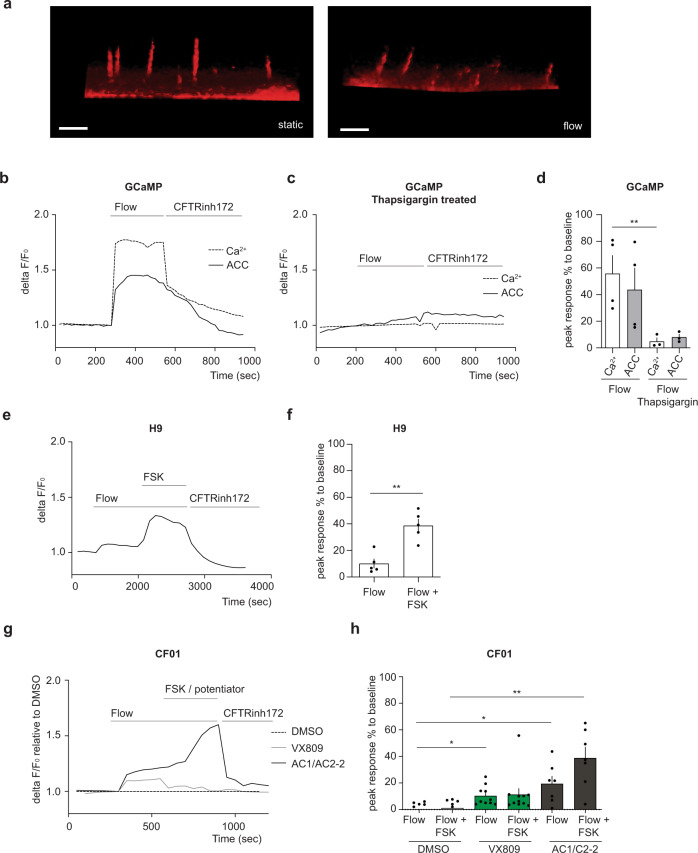
Fig. 7. CFTR function in ciliated hPSC-derived cholangiocyte in response to flow.
a Microscopic images show that cilium extend straight from the cell surface in the static condition (left). Flow (102 μl/s) bent cilium (right). Scale bars represent 5 μm. b Correlation between calcium influx and CFTR function. Continuous flow induced calcium influx and Apical Chloride Conductance (ACC) in GCaMP derived cholangiocyte. c Representative trace of the Apical Chloride Conductance (ACC) and calcium influx in GCaMP derived cholangiocyte with the presence of thapsigargin in response to flow. d Quantitative analysis showing the peak response of calcium and ACC, **p ≤ 0.01 one-way ANOVA. Data are represented as mean ± SEM (n = 3–4). e Representative trace of the Apical Chloride Conductance (ACC) in H9-derived cholangiocyte cysts in response to flow followed by flow in the presence of FSK. Response was blocked by CFTR inhibitor172. f Quantitative analysis showing the peak response of ACC in H9-derived cholangiocyte cysts in response to flow, **p ≤ 0.01 two-tailed Student’s t test (n = 5). g Representative trace of the apical chloride conductance (ACC) in CF01 derived cholangiocyte after treated with CF modulators in response to flow. h Quantitative analysis showing the peak response of ACC in CF01 derived cholangiocyte in response to flow in the presence of CFTR modulators, *p ≤ 0.05, **p ≤ 0.01 one-way ANOVA. Data are represented as mean ± SEM (n = 5–11).

