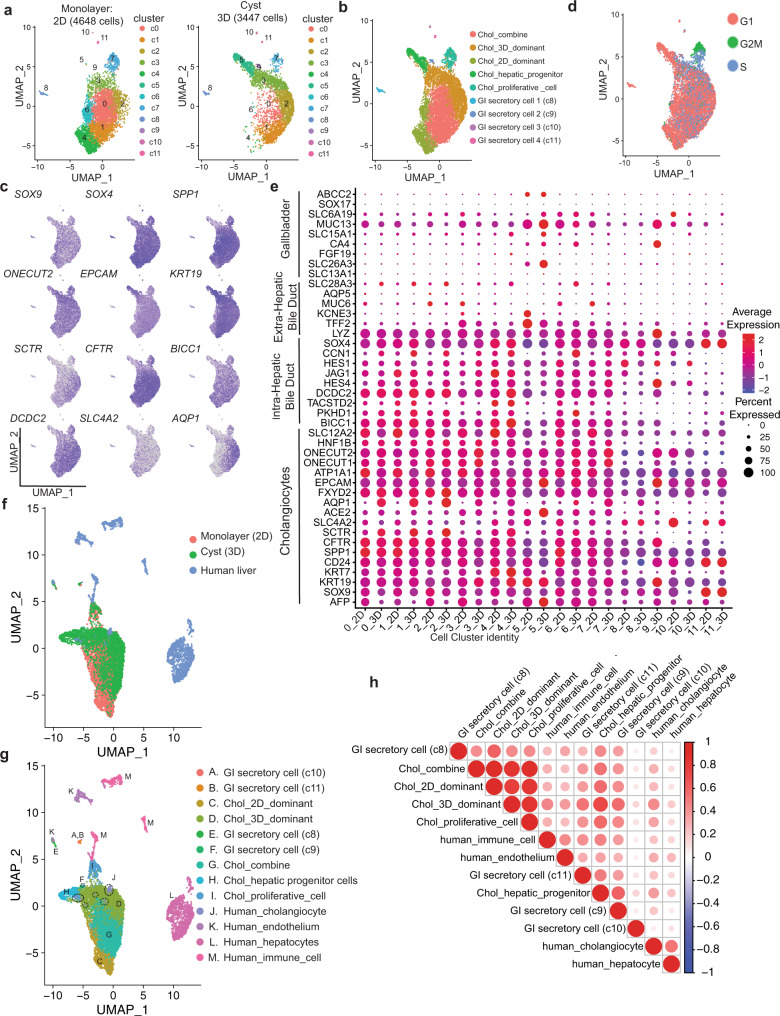
Fig. 8. Global gene analysis of 2D and 3D cyst/organoids hPSC-derived cholangiocytes.
a UMAP projection of 2D (left) and 3D (right) hPSC-derived cholangiocytes labeled by cell cluster. b UMAP projection of 2D dominant, 3D dominant, and 2D/3D combine populations of hPSC-derived cholangiocytes. c UMAP plots displaying the expressions of selected cholangiocyte markers. d UMAP plots showing cells in various cell cycles. e Dot plots displaying expression of genes indicative of cholangiocytes and known markers for different regions of primary bile ducts. The plot is split by cluster ID (0–11) and data source (2D vs. 3D). Size of the dot represents proportion of the population that expresses each gene. Color indicates the means of average expression level. f UMAP projection of 2D and 3D hPSC-derived cholangiocytes and adult human liver cells labeled by data source. g UMAP projection of 2D and 3D hPSC-derived cholangiocytes and human adult liver cells labeled by pre-annotated cell type. Circles with dotted line represent human adult cholangiocyte (cluster J). h Correlation matrix summarizing Pearson correlation coefficient measuring the correlation between hPSC-derived cholangiocyte populations and human adult liver cells.

