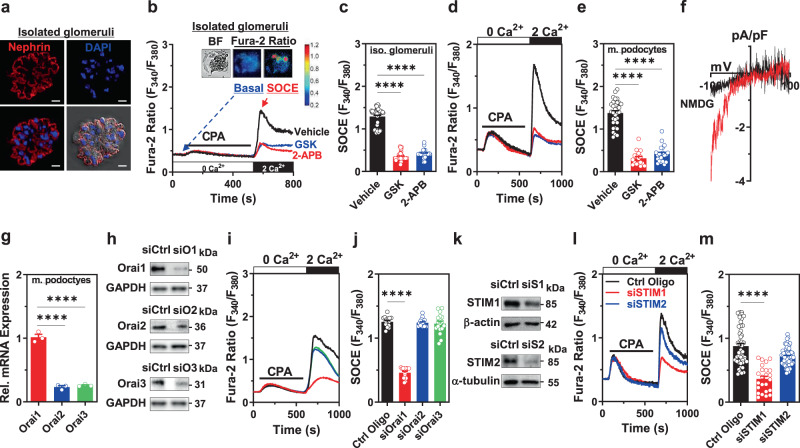
Fig. 1. Orai1/STIM1 is a primary molecular component of functional store-operated Ca2+ entry (SOCE) in podocytes.
a Immunofluorescence images of nephrin (red) and DAPI (blue) stains in isolated mouse glomeruli and differential interference contrast (DIC) results combined with those of nephrin and DAPI staining. Scale bar = 10 μm. b Effect of Orai inhibitors on functional SOCE in isolated mouse glomeruli. Representative images of bright-field (BF) and fura-2 fluorescence microscopy of podocytes in the basal and SOCE states, carried out in situ on acutely isolated mouse glomeruli, in the same manner as described in the previous reports9. Pre-treatment with Orai inhibitors, GSK (GSK-7975A; 3 μM) or 2-APB (100 μM), was performed 1 h before measuring SOCE. c Summary of the SOCE in b. n = 51 (WT), 39 (GSK), and 33 (2-APB) isolated (iso.) glomeruli per group. d Effects of Orai inhibitors on SOCE in immortalized cultured mouse podocytes. e Summary of the SOCE in d. n = 32 (WT), 17 (GSK), and 21 (2-APB) cells per each group. f Current–voltage (I–V) relationship of the CRAC current in cultured mouse podocytes. g Relative mRNA levels of Orai channels (1, 2, and 3) in mouse podocytes. n = 3 independent experiments. h Validation of the siRNA knockdown of the Orai isoforms in mouse podocytes. Control Oligo (siCtrl) was used as non-targeting control siRNA and GAPDH was used as a loading control. i Effect of the siRNA knockdown of Orai proteins on SOCE in mouse podocytes. j Summary of the SOCE in i. n = 16 (Ctrl Oligo), 14 (siOrai1), 16 (siOrai2), 17 (siOrai3) cells per each group. k Validation of siRNA knockdown of STIM1 and 2 in mouse podocytes. l Effect of siRNA silencing of STIM1 or 2 on SOCE in mouse podocytes. m Summary of the SOCE in l. n = 48 (Ctrl Oligo), 24 (siSTIM1), 67 (siSTIM2) cells per each group. All experiments were repeated three times independently (a, h, k). Bar graphs are expressed as mean ± SEM. One-way ANOVA followed by Dunnett’s multiple comparisons test (c, e, g, j, and m). ****p < 0.0001.

