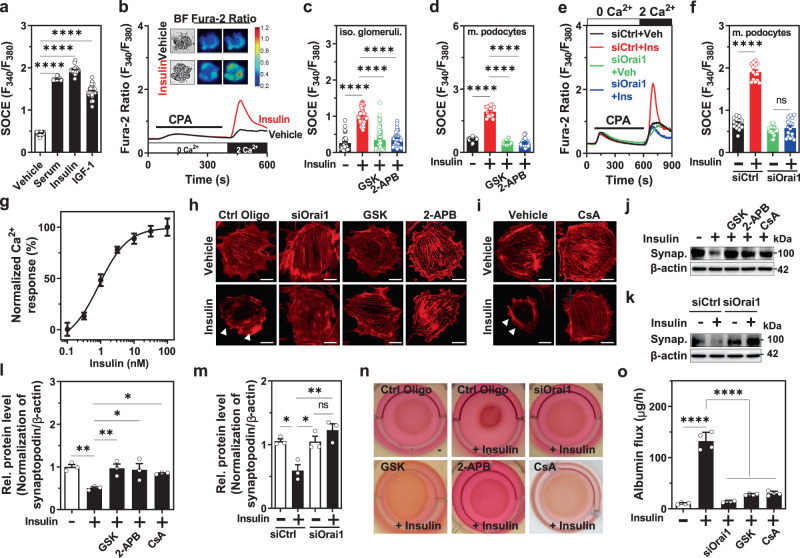
Fig. 2. Insulin stimulates Orai1-mediated store-operated Ca2+ entry (SOCE), aggravating actin rearrangement and transepithelial albumin leakage in mouse podocytes.
a Vehicle (n = 29 cells) or serum growth factors including serum (10%) (n = 26 cells), insulin (100 nM for 1 h, n = 27 cells), and IGF-1 (10 nM for 1 h, n = 29 cells) increased SOCE in podocytes. To examine insulin effects, cells or isolated glomeruli were incubated in a serum-free medium for ~16 h before insulin treatment for the indicated duration. b Representative SOCE traces with the images of bright-field and fura-2 fluorescence (upper panel) microscopy of insulin-treated podocytes (100 nM) carried out in situ on acutely isolated mouse glomeruli. c, d Effect of SOCE inhibitors [GSK (GSK-7975A; 3 μM) or 2-APB (100 μM)] on insulin-stimulated SOCE in isolated (iso.) glomeruli (c) and mouse (m.) podocytes (d). n = 33 (Vehicle), 77 (Insulin), 74 (Insulin+GSK), and 33 (Insulin+2-APB) glomeruli (c) and 19 (Vehicle), 17 (Insulin), 15 (Insulin+GSK), and 21 (Insulin+2-APB) cells (d) per group. e Representative SOCE traces showing the effect of Orai1 knockdown by siRNA on insulin-stimulated SOCE in cultured mouse podocytes. f Summary of the SOCE in e. n = 14 (siCtrl+Veh), 14 (siCtrl+Insulin), 20 (siOrai1+Veh), and 18 (siOrai1+Insulin) cells per each group. g Dose–response of insulin on SOCE in cultured mouse podocytes. n = 21, 21, 32, 10, 33, 15, 19 cells for each point, respectively. EC50 of insulin is approximately 0.95 nM. h, i Effect of Orai1-mediated SOCE inhibition by siRNA Orai1 (siOrai1) or GSK or 2-APB (h) and effect of cyclosporine A (CsA; 10 μM) (i) on insulin-mediated actin rearrangement (white arrow). Scale bar = 50 μm. The experiments were repeated twice and several cells were analyzed for each experiment. j Effect of SOCE inhibitors and CsA on insulin-mediated depletion of synaptopodin (Synap.) in cultured mouse podocytes. k Effect of siRNA Orai1 on the insulin-induced dissolution of synaptopodin. l, m. Summary of relative synaptopodin expression in the j and k, respectively. n = 3 independent experiments. n Collagen contraction assay showing insulin-stimulated podocyte retraction, which is rescued by the inhibition of Orai1-calcineurin pathway. This assay was repeated two times independently. o Effect of Orai1 knockdown and GSK and CsA treatment on insulin-mediated transepithelial albumin leakage in mouse podocytes. n = 4 independent experiments. Bar graphs are expressed as mean ± SEM and analyzed by one-way ANOVA followed by Tukey’s multiple comparisons test. *p < 0.05, **p < 0.01, ***p < 0.001, ****p < 0.0001; ns not significant (a, c, d, f, l, m, o, p).

