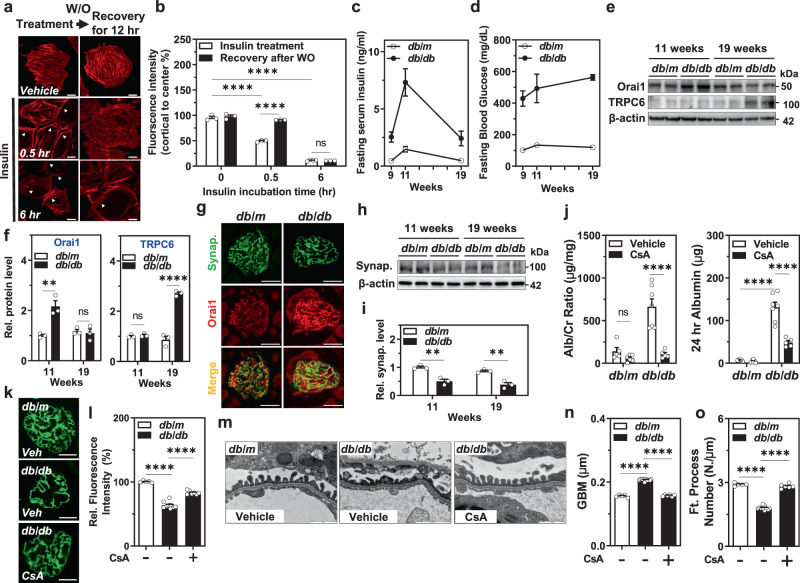
Fig. 5. Orai1 is overexpressed in hyperinsulinemic db/db mice and CsA ameliorates slit-diaphragm disruption and albuminuria.
a Time-dependent recovery of insulin-mediated actin rearrangement. Podocytes were incubated with insulin for 30 min (short-term) or 6 h (long-term), washed out (W/O), and further incubated in an insulin-free medium for 12 h before phalloidin staining. White arrows indicate actin rearrangement by insulin treatment. Scale bar = 50 μm. b Quantification of the actin fiber intensity in a. n = 3, 3, 4, 5, 4, and 3 dishes, twenty images in each dish. c, d Analysis of the serum levels of insulin (ng/ml) (c) and glucose (mg/dL) (d) in db/m and db/db mice at 9, 11, and 19 weeks of age (n = 5 mice each). e Representative immunoblotting showing Orai1 and TRPC6 expression in the glomerulus of db/m and db/db mice at 11 and 19 weeks. f Densitometry of Orai1 (left) and TRPC6 (right) in e. Relative (Rel.) protein levels were normalized to db/m mice (11 weeks of age) n = 3 independent experiments. g Representative immunofluorescence images of synaptopodin (synap.; green) and Orai1 (red) in the glomeruli of db/m and db/db mice. Immunostaining was repeated five times independently from 5 mice each. Scale bar = 25 μm. h Immunoblotting analysis showing synaptopodin expression in the glomeruli of db/m and db/db mice at 11 and 19 weeks. i Quantification of the western blots in h. n = 3 independent experiments. j Effect of cyclosporin A (CsA, i.p. injection) on urine Alb/Cr ratio (left) and 24 h urinary albumin excretion (right) in db/m and db/db mice (n = 5–7 images from mice each). k Immunofluorescence staining showing the effect of CsA on synaptopodin dissolution in db/db mice. Scale bar = 25 μm. l Summary of synaptopodin quantification in k. n = 30 images from 5 to 10 mice each. m Representative TEM images of foot processes from db/m and db/db mice with/without administration of CsA. Magnification is ×30,000. Scale bar = 1 μm. n, o GBM thickness (n) and an average number of foot processes per 1 μm length of GBM (o) in db/m and db/db mice with/without administration of CsA. Thirty images from 5–7 mice in each group. Bar graph data are expressed as mean ± SEM and were analyzed using two-way ANOVA followed by Tukey’s multiple comparisons test. **p < 0.01, ****p < 0.0001; ns not significant.

