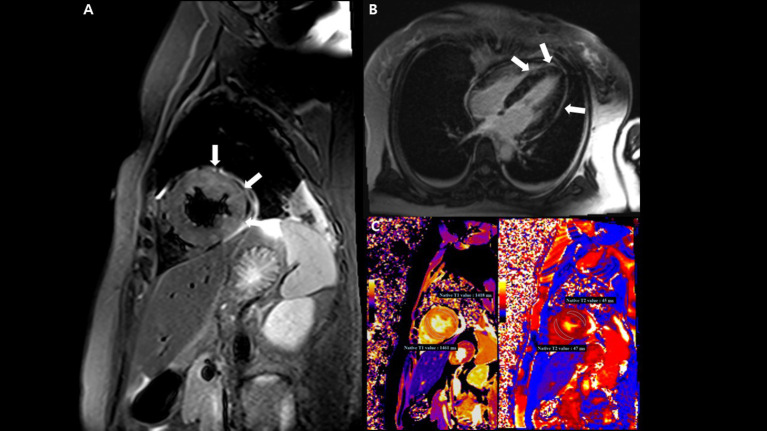
Figure 4.
Cardiac magnetic resonance imaging (MRI) findings. (A) T2-weighted short TI inversion recovery MRI at 3T in a short-axis view shows multifocal high signal intensities at the mid anterior and lateral wall (arrow) indicating myocardial edema. (B) Late gadolinium enhancement imaging in a four-chamber view displays multifocal mid wall enhancement (arrow) indicating inflammatory myocardial necrosis. (C) T1 mapping and T2 mapping in a short-axis view show elevated T1 and T2 relaxation times at the mid ventricular level, indicating an acute myocardial injury (regional T1 relaxation time-1,418 ms at the anterolateral wall and 1,461 ms at the septal wall, regional T2 relaxation time-45 ms at the anterolateral wall and 47 ms at the septal wall; institution-specific cutoff values for acute myocarditis- T1 global: ≥1,230 ms and T2 global: ≥36 ms).

