
Figure 4.
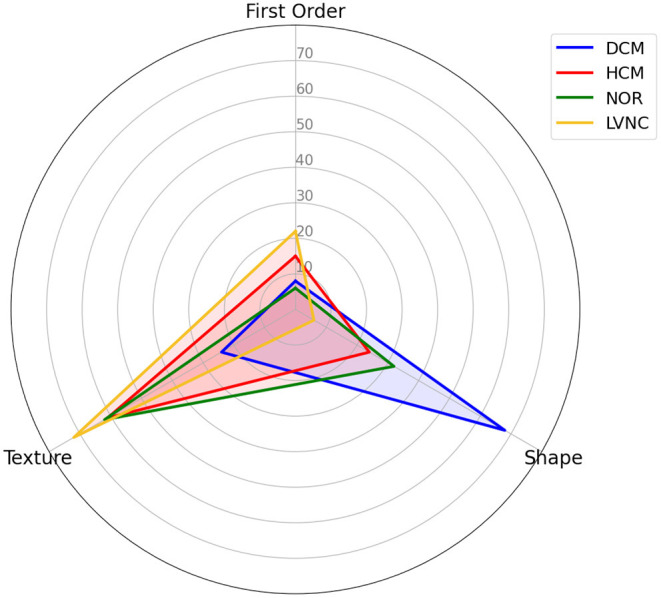
Differential diagnosis overlapping radar plot, comparing the distribution of the selected radiomics across types of radiomics.
Official websites use .gov
A
.gov website belongs to an official
government organization in the United States.
Secure .gov websites use HTTPS
A lock (
) or https:// means you've safely
connected to the .gov website. Share sensitive
information only on official, secure websites.
Differential diagnosis overlapping radar plot, comparing the distribution of the selected radiomics across types of radiomics.