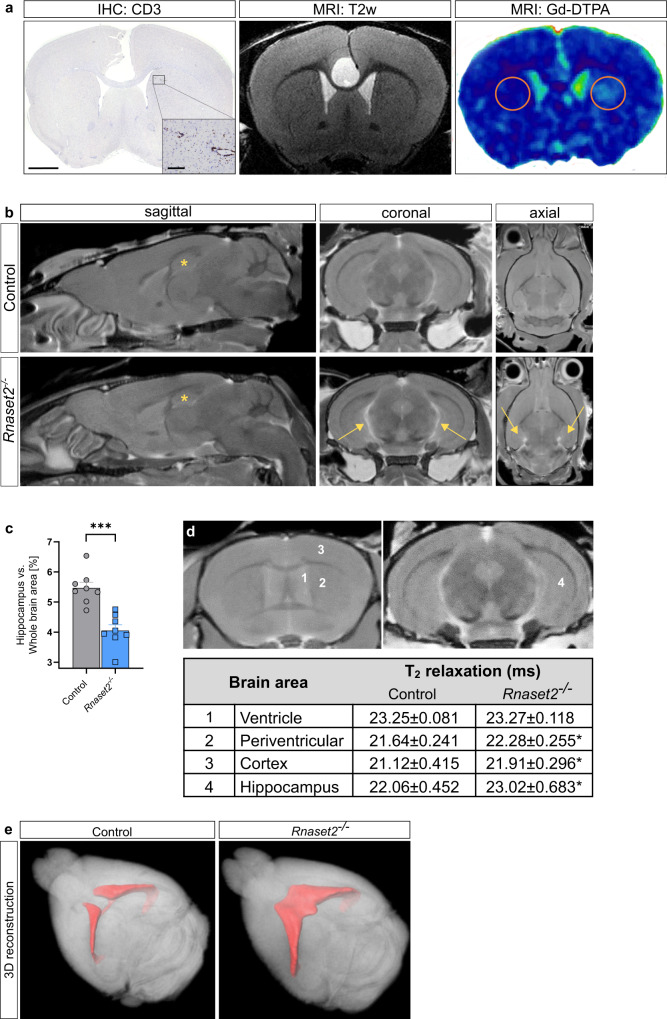
Fig. 5. Magnetic resonance imaging (MRI) of neuroinflammation and neurodegeneration.
a Light microscopic image of CD3 immunohistochemistry (IHC: CD3) revealed a perivascular T cell infiltration near the left ventricle (inlay, left image). Scale bar, 1 mm and 100 µm respectively. Corresponding T2-weighted coronary MRI (MRI: T2w) showed no remarkable alterations (middle image). Corresponding map of percentage signal enhancement (MRI: Gd-DTPA) revealed gadolinium enhancement in the region of perivascular T cell infiltration near the left ventricle in Rnaset2−/− mice (red circles, right image). Representative images of n = 2 biological replicates for Rnaset2−/− and control mice, respectively. b Representative magnetic resonance anatomical images (of n = 8 Rnaset2−/− and control mice, respectively) in sagittal, coronal, and axial plane showing significant hippocampal atrophy (asterisk) in Rnaset2−/− mice compared to controls. Ventricular enlargement, which may have been arisen due to shrinkage of hippocampus are shown with (arrows). c Percent area of hippocampus (left and right) with respect to whole brain area. The size of the hippocampus relative to the whole brain was significantly smaller (p = 0.0002). n = 8 Rnaset2−/− and control mice from two independent experiments. Data depicted as the mean ± SEM. P value of one-way ANOVA are presented as ***p < 0.001. d T2 relaxation time measurement in various brain regions displayed a significant increase in cortex, hippocampus and periventricular region of Rnaset2−/− mice in n = 8 Rnaset2−/− and control mice, respectively. Region of interest (ROI) selected for T2 relaxation time measurements are shown in left images. ROI: (1) ventricle, (2) periventricular, (3) cortex, (4) hippocampus. Data depicted as the mean ± SEM. p values of one-way ANOVA are represented as *p < 0.05. e 3-dimensional reconstruction of the ventricular system in MRI showed an expansion in Rnaset2−/− (right side) versus control mice (left side) as an indication of a general brain atrophy. Source data are provided as a Source data file.

