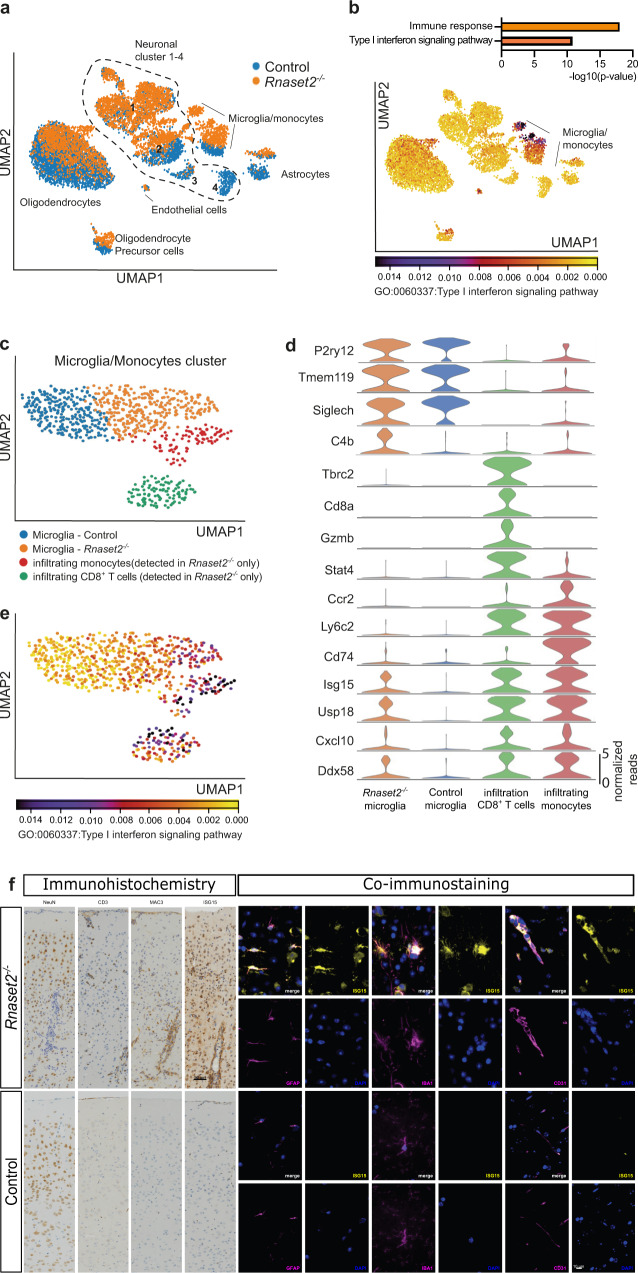
Fig. 7. Single nuclei RNA sequencing analyses of the caudate putamen confirms type I interferon-driven neuroinflammation.
a UMAP clustering of the caudate putamen from Rnaset2−/− and control mice. b Upper panel: Differential gene-expression was performed to compare Rnaset2−/− and control mice across all detected cell types. GO-term analysis (biological processes) reveals immune response and type I interferon signaling as the major biological processes to be affected in the caudate putamen from Rnaset2−/− mice. Lower panel: UMAP indicating that the expression of the type I interferon signaling pathway (GO:0060337) is particularly obvious in the microglia/monocytes cluster. c UMAP clustering of the microglia/monocytes cluster clearly distinguished WT and Rnaset2−/− microglia and identifies infiltrating monocytes and CD8+ T cells. d Violin plot showing the expression of marker genes within the 4 different clusters detected in (C). e UMAP clustering of the microglia/monocytes cluster indicating that the expression of the type I interferon signaling pathway (GO:0060337) is particularly obvious in the microglia from Rnaset2−/− mice and within the infiltrating monocytes and CD8+ T cells. f Columns 1–4: IHC for neurons (NeuN), T cells (CD3), macrophages/activated microglia (MAC3) and ISG15 in the cortex of Rnaset2−/− (representative of n = 5; upper panel) and control (representative of n = 6; lower panel) mice demonstrates the diffuse and perivascular infiltration of T cells (CD3) and macrophages/activated microglia (MAC3) and an extensive expression of ISG15 in Rnaset2−/− mice. Scale bar, 50 µM. Columns 5–10: Exemplary co-immunofluorescence staining confirm expression of ISG15 in astrocytes (GFAP), microglia/macrophages (IBA1), and endothelial cells (CD31) in Rnaset2−/− mice. Scale bar, 10 µM.

