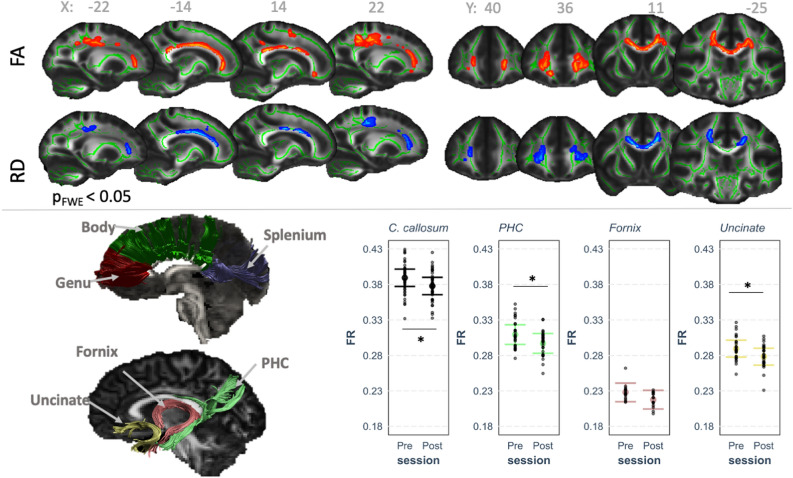
Figure 1.
Diffusion MRI analysis showing exercise-induced differences. Top panel shows TBSS results for fractional anisotropy (FA) and radial diffusivity (RD) differences between the pre- and post-exercise intervention scans, clusters are displayed at p < 0.05, FWE-corrected (TFCE) and fattened with the “tbss_fill” script for the purpose of better visualization, shown against the the mean FA fibre skeleton (green) and overlaid on the FMRIB FA 1 mm template. Red represents a significant increase in values (post > pre) and blue represents a decrease (post < pre). Bottom panel shows representative tract segmentations for the corpus callosum (genu [red], body [green], splenium [purple]), uncinate fasciculus (yellow), fornix (pink), and parahippocampal cingulum (PHC; green), overlaid on the FA map. Graph shows the partial residual plot from the linear mixed effect model, showing the effect of exercise on restricted fraction (FR), with the effects of all the control variables accounted for, with error bars representing 95% confidence intervals and individual data points. The raw tractography FR data is graphically represented in Supplementary Fig. 5.

