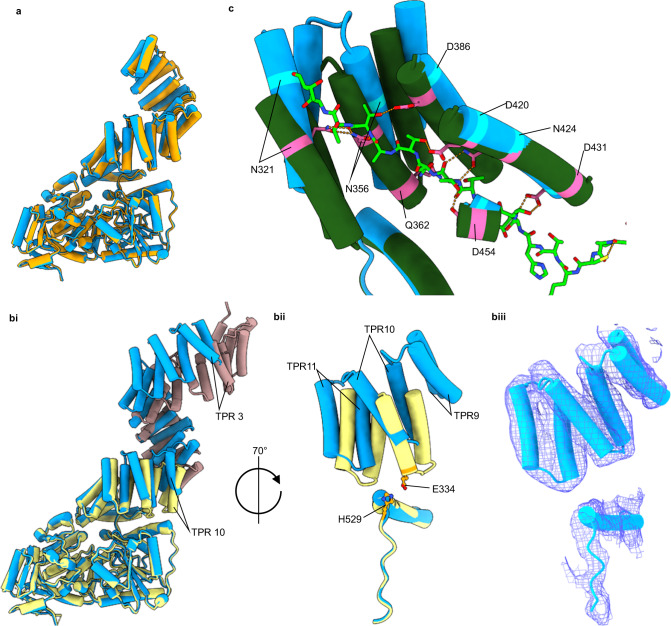
Fig. 4. Comparison of cryo-EM model to crystal structures.
a Superimposition of chain A (blue) onto chain B (orange) of the 5.3 Å structure demonstrates the distortion of the twofold symmetry. bi Comparison of the cryo-EM model (chain A, blue) to the OGT/UDP X-ray structure with the TPR 11.5 X-ray structure (chain A) superimposed (PDB: 3PE3, yellow. PDB: 1W3B, pink). Residues 544–1028 were used for superimposition. bii TPRs 9–11 and their relative position to residues 505–538 of catalytic region. Residues suggested to promote TPR 10 anchoring to the catalytic region depicted in orange. biii Cryo-EM map into which the TPRs and residues 505–538 were modelled. c Comparison of cryo-EM model (chain A) to the OGT/UDP/HCF-1 peptide ternary complex (PDB: 4N3C, green)9. Residues 544–1028 were superimposed. Hydrogen bonding interactions depicted as dashed orange lines.

