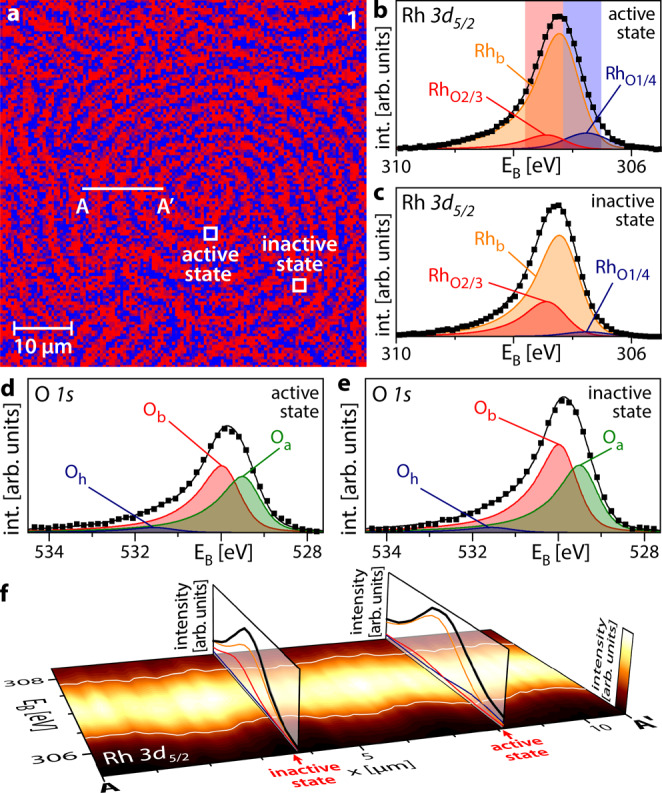
Fig. 2. Oscillating pattern in H2 oxidation on Rh (T = 453 K, pO2 = 1.1 × 10⁻⁶ mbar, pH2 = 1.2 × 10⁻⁶ mbar).

a Rh 3d5/2 SPEM map of region 1 in Fig. 1a showing the distribution of 2/3 (red) and 1/4 (blue) oxygen-bound Rh states on the Rh(17 10 2) domain; b Rh 3d5/2 XPS spectrum corresponding to the catalytically active state. Rhb: bulk Rh; RhO2/3 and RhO1/4 correspond to Rh bound to oxygen; further details are given in the text. Squares: measured values; black solid line: sum of the deconvoluted components. The energy windows for constructing the SPEM map are shaded red and blue; c the same as in (b) but for the catalytically inactive state; d O 1 s XPS spectrum corresponding to the catalytically active state. Oa and Ob are associated with adsorbed atomic oxygen species, while Oh corresponds to the OH reaction intermediate. Squares: measured values; black solid line: sum of the deconvoluted components; e the same as in (d) but for the catalytically inactive state; f XPS spectral line profile along the line A-A′ marked in (a), with the colour code shown at the right edge. Vertical slices show exemplary spectra for the catalytically inactive and active states. The oscillating white lines serve as a guide for the eye.
