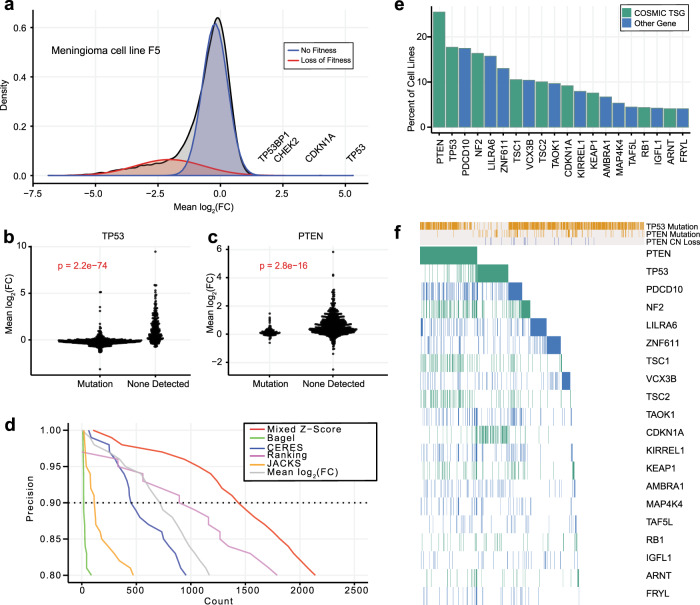
Fig. 1. Discovery of proliferation-suppressor genes.
a Fold-change distribution of a typical CRISPR knockout screen has a long left tail of essential genes, and a small number of genes whose knockout increases fitness (proliferation-suppressor genes, “PSG”). A two-component Gaussian mixture model (red, blue) models this distribution. b, c Fold change of common tumor suppressors across 808 cell lines (P values, two-sided Wilcoxon rank-sum test). d Precision vs. recall of mixed Z-score and other CRISPR analysis methods. Dashed line, 90% precision (10% FDR). e Fraction of cell lines in which known tumor suppressors (green) or other genes (blue, not defined as TSG by COSMIC) are classified as PS genes at 10% FDR. f Presence of each known TSG across 808 cell lines, vs. cell genetic background. Gold, mutation present; gray, absent. Green or blue, following color scheme in (e), gene is classified as a proliferation suppressor.

