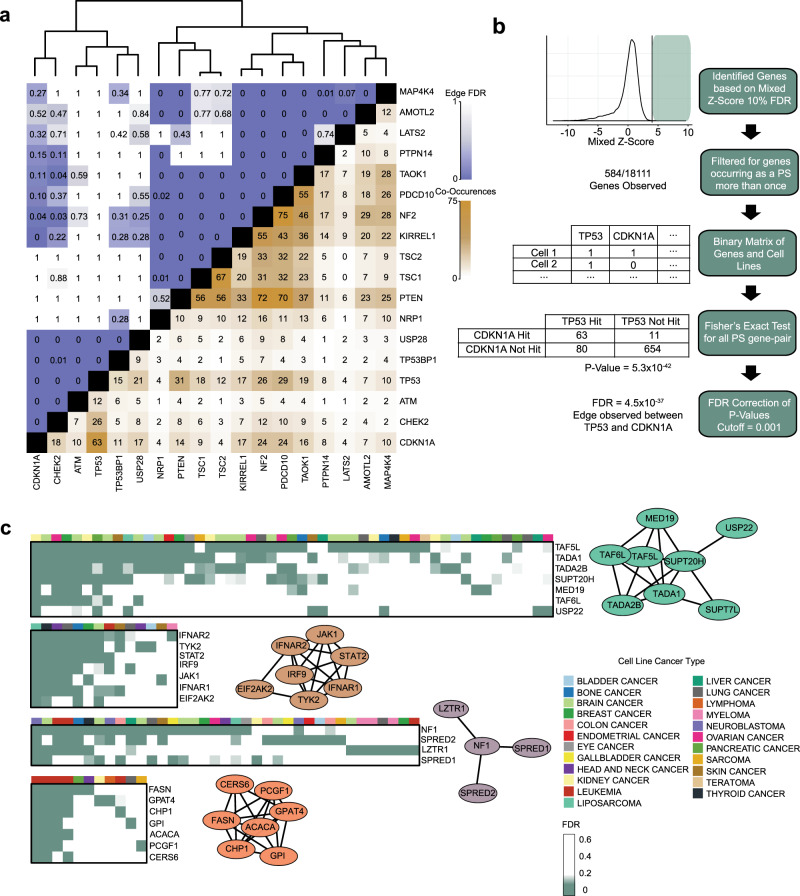
Fig. 2. Co-occurrence of PSG.
a Co-occurrence/mutual exclusivity of common TSG as PSG in CRISPR screens. Brown, number of cell lines in which two genes co-occur as PSG at 10% FDR. Blue, FDR of co-occurrence. Hierarchical clustering delineates functional modules. b Pipeline for building the co-PS network. c Examples from the Co-PS network. Nodes are connected by edges at FDR < 0.1%. Heatmaps indicate the presence of PSG vs. cell lineage.

