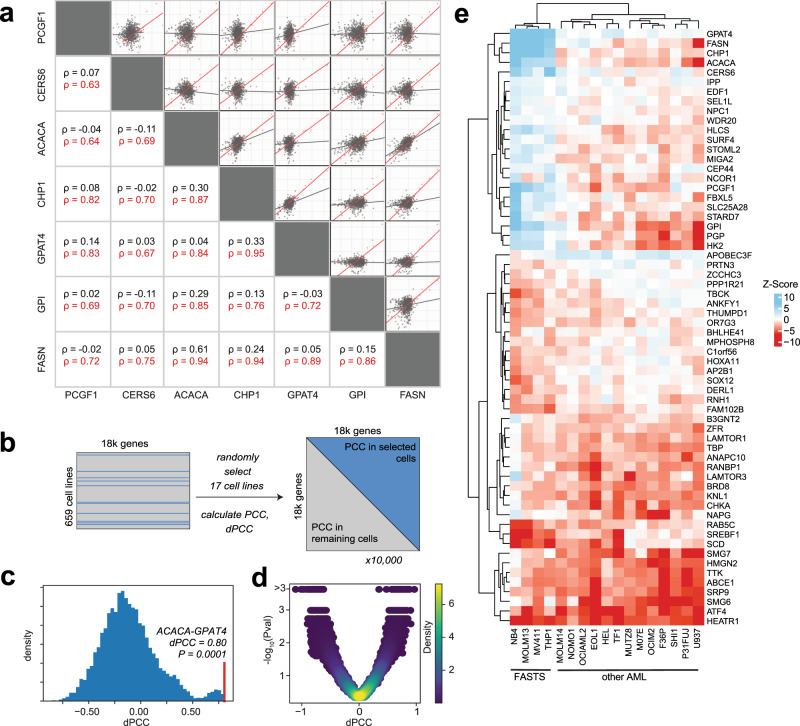
Fig. 3. Differential network analysis of fatty acid synthesis module.
a Among genes in the FAS module, Pearson correlation coefficients of mixed Z-score profiles are substantially higher in AML cells (red) than in other cells (gray). b Significance testing of differential PCC (dPCC) involves quality filtering of Avana data (n = 659 cell lines, including 17 AML cell lines), building a null distribution by randomly selecting 17 cell lines, and calculating PCC between all gene pairs in the selected cells and the remaining cells. c After 10,000 repeats, a null distribution is generated for each pair, and a P value (permutation test, n = 10,000) is calculated for the observed AML vs. other dPCC. d Volcano plot of dPCC vs. P value for all genes in the Co-PS cluster. e Heatmap of mixed Z-score for 17 AML cell lines in selected genes with high |mixed Z | and high |dPCC | . Clustering of cell lines indicates the putative fatty acid synthesis/tumor suppressor (FASTS) subtype.

