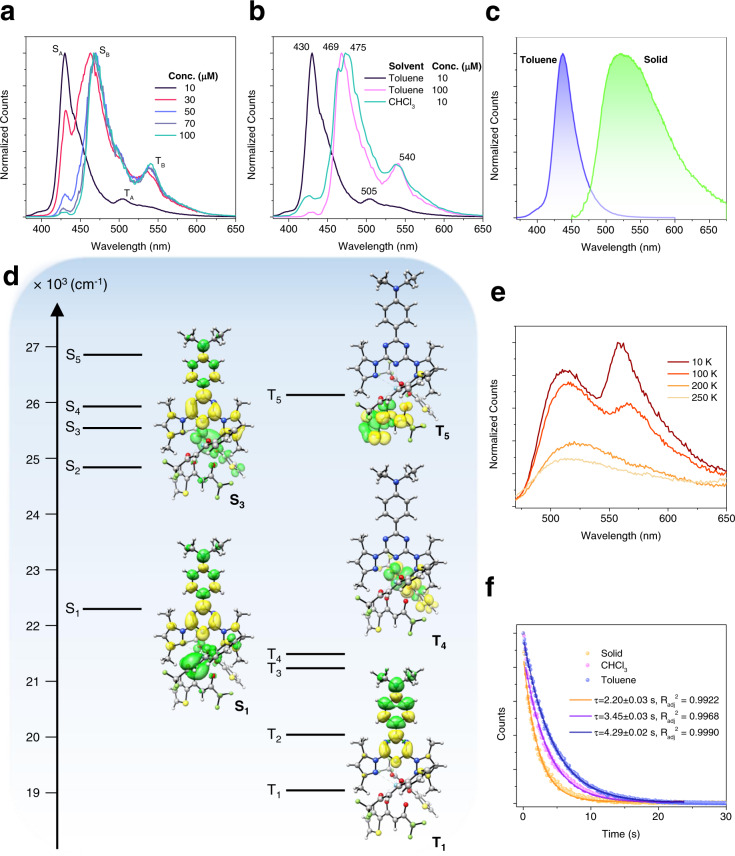
Fig. 2. Emission spectra using 355 nm excitation.
(a) The emission spectrum of LaL1(TTA)3 in toluene at different concentrations at 77 K. (b) The comparison of the 77 K emission spectrum of LaL1(TTA)3 at different concentrations in toluene and in CHCl3. The emission spectrum of LaL1(TTA)3 in toluene at high concentration resembles that of 10 μM concentration in CHCl3. (c) The comparison between the emission spectrum in toluene (10 μM) and that in the solid-state at room temperature. (d) The optimized structure of LaL1(TTA)3 and the energy diagram showing the computed TD-DFT energy levels, with corresponding orbital transitions. The ordinate is energy. The green colour of the orbitals represents the decrease in occupation during the electronic transition whilst that of yellow represents an increase. (e) The variation of the solid-state emission spectrum with temperature. The triplet peak at 560 nm is barely observed above 100 K. (f) Triplet state decays of LaL1(TTA)3 in CHCl3 (10 μM), toluene (10 μM) at 77 K and in the solid-state at 10 K. The fitted decay lifetimes are indicated with the adjusted coefficients of determination.

