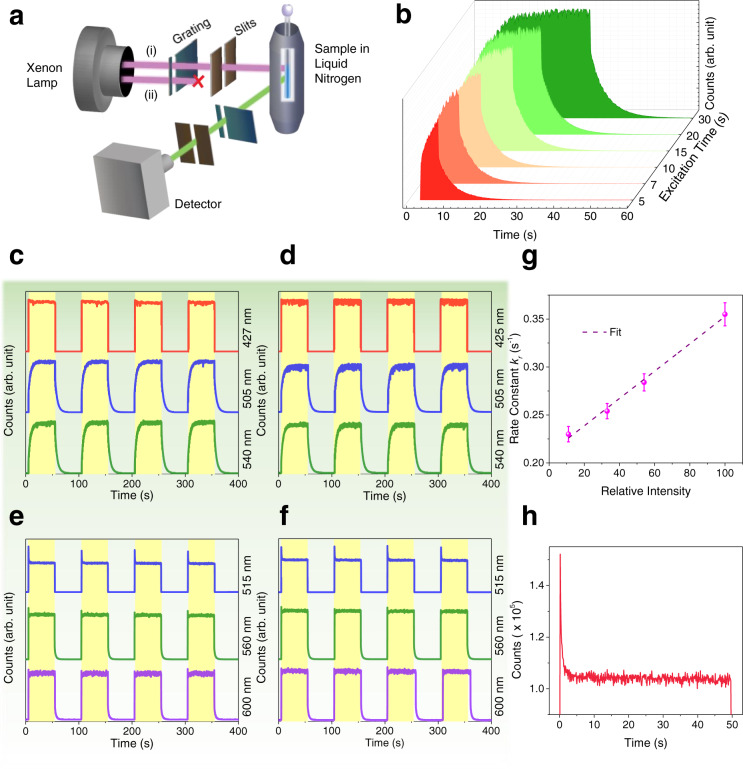
Fig. 3. Kinetics Profile of triplet and singlet transitions of LaL1(TTA)3 at 77 K (or 10 K where stated).
(a) Schematic setup of Horiba kinetics module. Two different modes were used with (i) the luminescence was monitored while the irradiation remained and (ii) the slit for irradiation was closed and only the luminescence after excitation was monitored. (b) The time-resolved intensity profile evolution of triplet emission (505 nm) of LaL1(TTA)3 with different excitation duration using 355 nm. Kinetics charging and decay profiles of LaL1(TTA)3 at 10 μM concentration in toluene using (c) 355 nm and (d) 395 nm excitation. (e),(f) Profiles for solid-state LaL1(TTA)3 at 10 K using (e) 355 nm and (f) 395 nm excitation. In each case for (c)-(f), the monitored wavelengths are indicated on the right-hand side. (g) Dependence of measured rise rate constant (kr) upon charging intensity for LaL1(TTA)3 at 10 μM concentration in toluene. The dashed line is fitted with the adjusted coefficient of determination Radj2 = 0.9928. Error bars represent the standard deviations of the averaged fitted rise rate constant. The decay constant (kd) is effectively constant (Supplementary Fig. 4k). (h) Expanded view of the initial part of the third cycle of (e) monitoring 515 nm emission.

