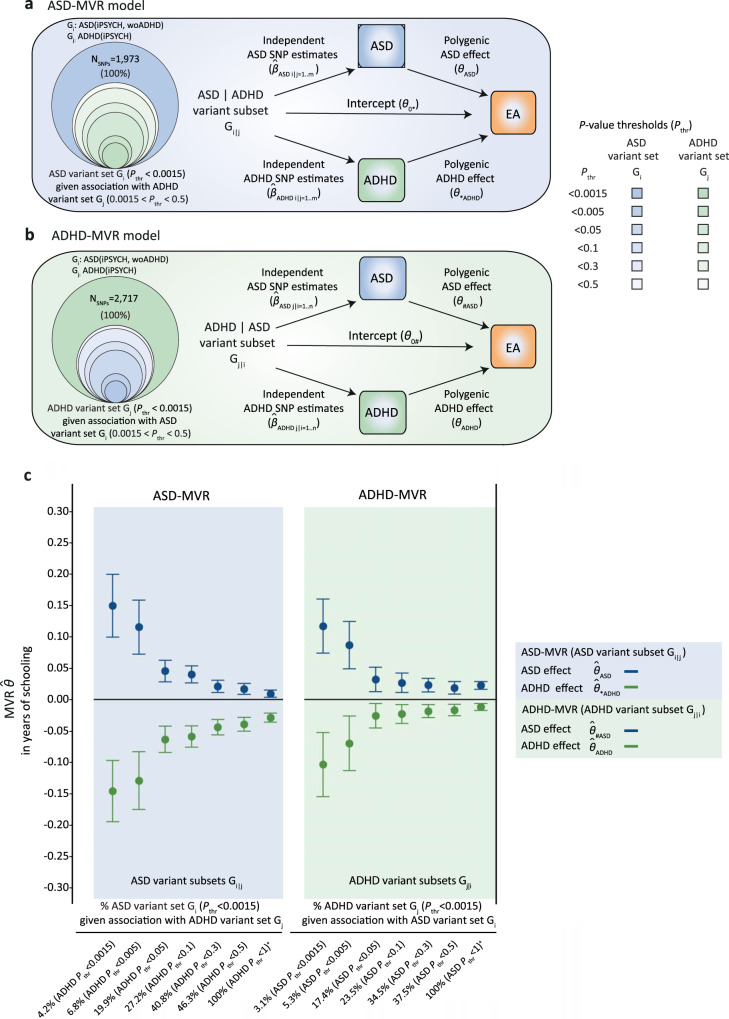
Fig. 4. Identification of single variants using conditional P-value thresholding.
Acyclic graphs illustrating the multivariable regression (MVR) design for (a) a set of independent ASD-related variants Gi, given joint association with ADHD variant set Gj (ASD-MVR with Gi|j) and (b) a set of independent ADHD-related variants Gj, given joint association with ASD variant set Gi (ADHD-MVR with Gj|i). Here, Gi|j and Gj|i are illustrated as subsets (concentric circles) of Gi and Gj across a grid of six P-values thresholds (0.0015 < Pthr < 0.5), based on ASD(iPSYCH, woADHD) and ADHD(iPSYCH) summary statistics. (c) ASD-MVR (ASD; *ADHD) and ADHD-MVR (ADHD; #ASD) effects as change in years of schooling per increase in log odds of ASD or ADHD liability (for the definition of *ADHD and #ASD, see Fig. 2). SNP sets Gi|j and Gj|i were selected from ASD(iPSYCH, woADHD) and ADHD(iPSYCH), as shown in (a, b). SNP estimates for ASD (ASD), ADHD (ADHD) and EA (EA) were extracted from ASD(iPSYCH,woADHD; N = 32,985), ADHD(iPSYCH; N = 37,076) and EA(SSGAC; N = 766,345) GWAS statistics respectively. Multivariate inverse-variance-weighted regression estimates and corresponding 95% confidence intervals (bars) are shown. Individual effect estimates, standard errors and corresponding P-values (t-statistic, two-sided test) are provided in Supplementary Tables 10–11. All MVR effects passed the multiple-testing threshold of P < 0.0023, except for ADHD effects estimated with ADHD-MVR (Gj|i: ADHD Pthr < 0.0015; ASD Pthr < 0.05), which were present as trend (P = 0.01). Source data are provided as a Source data file. ADHD Attention-Deficit/Hyperactivity Disorder, ASD Autism Spectrum Disorder, EA educational attainment, MVR multivariable regression; Pthr P-value threshold, SNP single-nucleotide polymorphism, woADHD without ADHD.

