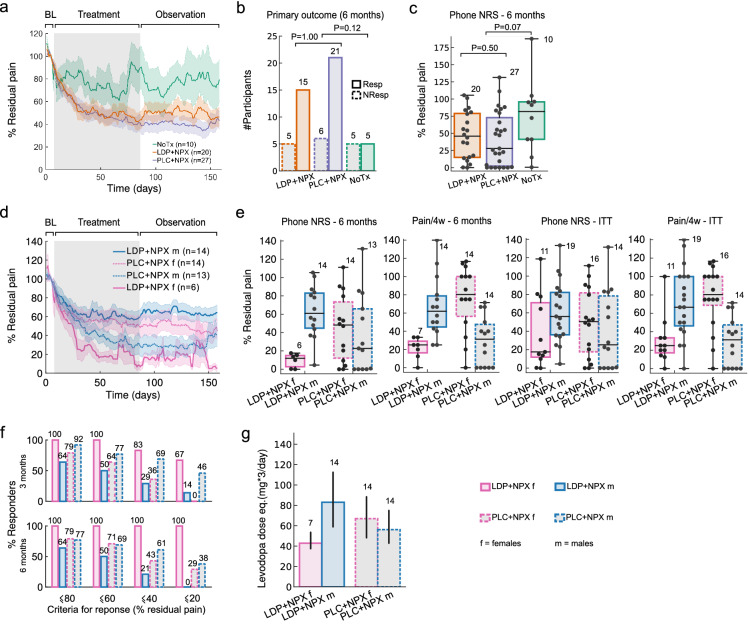
Fig. 2.
Back pain time course, response rates, and treatment by sex interaction. a Line plot depicts daily average residual back pain trajectories, per study arm: NoTx (green), LDP + NPX (orange), and PLC + NPX (purple) during baseline, treatment and post-treatment observation phases (displayed are 7, 78, and 73 days of ratings for each phase, respectively). There was an interaction between treatment and time (repeated measures mixed model ANOVA, F(314,8478) = 1.54, P < 0.001), with NoTx residual pain being greater than LDP + NPX (P = 0.09) and greater than PLC + NPX (P = 0.02, post hoc Dunnet test). Gray background indicates treatment phase, shaded areas ± SEM. b Response rates in the LDP + NPX group (75% of subjects were responders) were not different from PLC + NPX (78% were responders) (Fisher’s exact test, P = 1.00; with response criterion of greater than 20% reduction in mean pain intensity from baseline to 6 months, mean pain over 1 week of ratings). A trend for superior response rates was seen in the treated population, relative to NoTx (Fisher’s exact test, P = 0.12). c Residual pain at 6 months (phone NRS, 1-week averaged pain ratings relative to baseline) was not statistically different between study arms but showed a trend (Kruskal–Wallis test, P = 0.15). Comparing between NoTx and the two treatments together, treated individuals presented larger improvement in pain (Mann–Whitney U test, P = 0.07; medians, quartiles and ranges are shown). d Line plot depicts average residual daily pain trajectories for female and male participants separately, per treatment arm. There was an interaction between time, treatment, and sex (F(157,6751) = 3.105, P < 0.001, repeated measures mixed model ANOVA), with LDP + NPX female participants presenting lower residual pain than LDP + NPX male participants (P < 0.05), according to post hoc Tukey test. Shaded areas represent ± SEM. e At 6 months, four measures indicated sex by treatment interaction: 1. residual pain (phone NRS) showed this interaction (two-way ANOVA, F(1,43) = 8.16, P = 0.007); 2. back pain over 4 weeks (Pain/4w) confirms the finding (two-way ANOVA, F(1,45) = 24.59, P = 0.00001); 3. Modified intent to treat analysis (ITT), including all subjects with valid data who were randomized in the study, showed a trend for 1-week average phone NRS (two-way ANOVA, F(1,56) = 2.33, P = 0.13); 4. ITT for 4-week pain showed a robust interaction (Pain/4w, two-way ANOVA, F(1,56) = 26.02, P = 0.000004). Box plots show median, quartiles, and ranges; while numerals indicate number of subjects. f Response rates at both 3 and 6 months across different criteria. LDP + NPX showed complete recovery across all thresholds in all female participants at 6 months, while PLC + NPX was less effective. g In LDP + NPX treated individuals, the average maximum administered dose (given three times/day) was lower for female participants than male participants (two-tailed t test, P = 0.07). Just as with pain levels, a treatment by sex interaction was seen in the levels of drug doses received (two-way ANOVA, F(1,45) = 4.54, P = 0.04). Levodopa dose equivalence was computed according to number of placebo tablets. BL baseline, LDP + NPX levodopa/carbidopa + naproxen, PLC + NPX placebo + naproxen, NoTx no-treatment, Resp responders, NonResp non-responders

