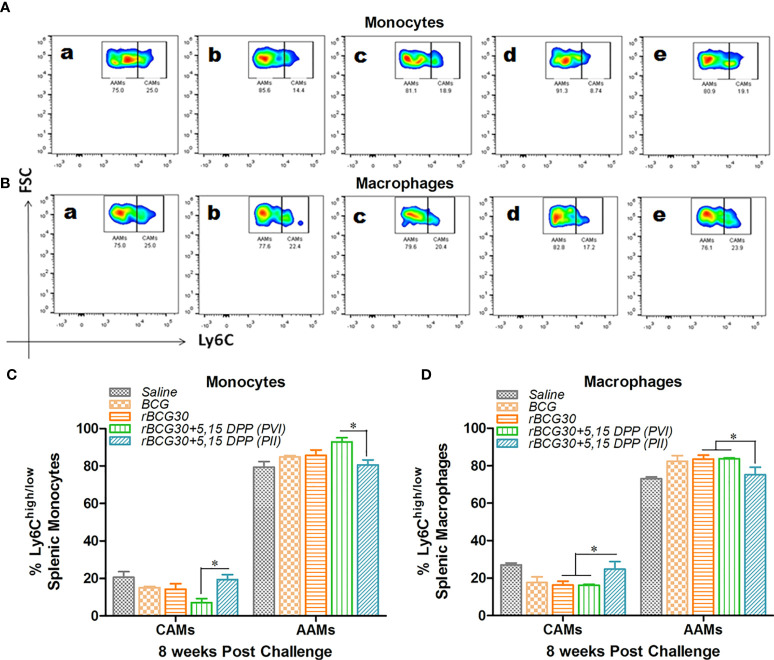
Figure 3.
Comparative abundance of classical (CAMs) and alternative (AAMs) splenic monocytes/macrophages at week 8 post-challenge. Representative FACS micrographs and bar graphs in the figure represents the percent frequency of Ly6Chigh CAMs and Ly6Clow AAMs among (A, C) CD11b+F4/80-SSClow monocytes and (B, D) CD11b+F4/80+SSClow macrophages isolated from the spleen of mice (n=4-5) belonging to various groups and profiled using flow cytometry. The various groups included in the study and depicted in the FACS micrographs were: (a) Saline, (b) BCG, (c) rBCG30, (d) rBCG30+5,15-DPP (PVI), and (e) rBCG30+5,15-DPP (PII). The results depicted in the figure are representative of two independent experiments and are presented as means ± SEM of one of the two experiments with similar observations. The significance testing of differences between various groups was performed employing Two-way ANOVA followed by Bonferroni’s multiple comparison post-test. The p values, <0.05(*), <0.01(**), <0.001(***) were considered as significant for analysis and interpretation of the data.

