Figure 6.
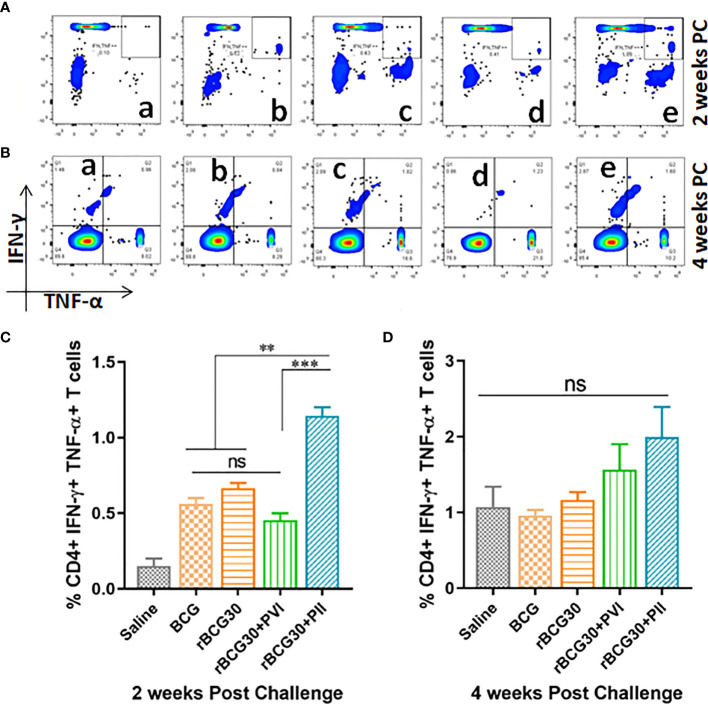
Multifunctional CD4+ T cell response post-challenge with Mtb. Splenocytes isolated from various immunized and immunotherapy treated animals were profiled employing flow cytometry for simultaneous production of IFN-γ and TNF-α by CD3+CD4+ T cells at 2 as well as 4 weeks PC. The figure depicts representative FACS plots of CD4+ MFTs belonging to (a) Saline, (b) BCG, (c) rBCG30, (d) rBCG30+5,15-DPP (PVI), and (e) rBCG30+5,15-DPP (PII) groups, at (A) 2 and (B) 4 weeks PC, respectively, and corresponding quantitative assessment in the form of bar graphs (C, D). Cells were stimulated with native Ag85B antigen from Mtb (5 µg/ml). The data were analyzed using One-way ANOVA followed by Tukey’s multiple comparison test and are shown as the means ( ± SEM) from one of the two independent experiments with similar observations performed in at least three biological replicates, where p<0.05(*), p<0.01(**), and p<0.001(***) were considered significant. ns, non-significant.

