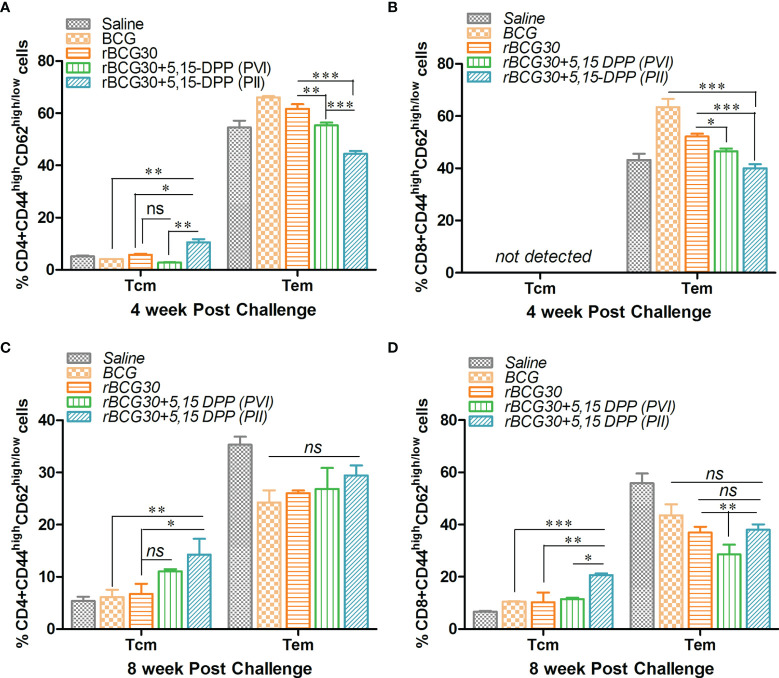
Figure 8.
Evaluation of T cells memory response at 4 and 8 weeks post-challenge. Antigen-specific CD4+ and CD8+ T central and effector memory response was assessed in splenocytes isolated from various groups of mice at both 4 and 8 weeks PC. The bar graphs in the figure depict the comparative magnitude (in percent) of T effector (Tem) (CD44highCD62Llow) and T central (Tcm) (CD44highCD62Lhigh) cells among (A, C) CD4+, and (B, D) CD8+ memory T cells at 4 (upper panel) as well as 8 (lower panel) weeks PC, respectively. The data were analyzed by employing two-way ANOVA followed by Bonferroni’s multiple comparison test and are shown as means ( ± SEM) from one of the two independent experiments with similar observations performed in at least three biological replicates, where p<0.05(*), p<0.01(**), and p<0.001(***) were considered significant. ns, non-significant.

