FIGURE 3.
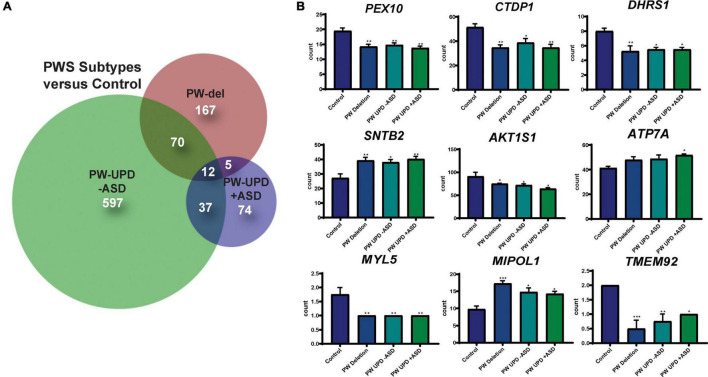
DPSC-derived neuronal cultures define PWS subtype specific expression and a core PWS molecular signature. (A) Venn diagram using all the significantly differentially expressed transcripts (p-value ≤ 0.05, FDR ≤ 0.05) versus control for each PWS subtype created using BioVenn (Hulsen et al., 2008). (B) Individual bar graphs showing mean counts per transcript across all groups for each of the transcripts located outside of the PWS critical region and identified as common across all PWS subtypes. These 9 genes, along with MAGEL2, SNRPN, and SNURF, represent a core molecular signature for PWS associated changes in neurons. Significance was determined by individual t-tests versus control for each subgroup (p ≤ 0.05). * = p-value ≤ 0.05, ** = p-value ≤ 0.01, *** = p-value ≤ 0.005.

