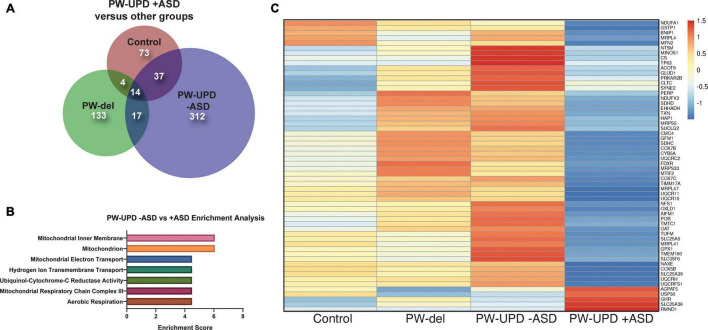
FIGURE 4.
RNAseq analysis reveals enrichment in differentially expressed mitochondrial transcripts in the PW-UPD + ASD group. (A) Venn diagram using all the significantly differentially expressed transcripts (p-value ≤ 0.05, FDR ≤ 0.05) versus PW-UPD + ASD for each PWS subtype and control created using BioVenn (Hulsen et al., 2008). (B) The list of differentially expressed transcripts PW-UPD -ASD versus UPD + ASD (p-value ≤ 0.05, FDR ≤ 0.05) was used as input for DAVID (Huang da et al., 2009a, b) enrichment analysis. The top enrichments (enrichment score ≥ 3.0) were transcripts located within mitochondria and having mitochondrial functions (p-value ≤ 0.002). (C) Heatmap of transcripts identified by DAVID analysis as mitochondrial related. Expression of genes identified as driving the mitochondria enrichment in the PW-UPD + ASD group were used to create this heatmap across all subgroups (Metsalu and Vilo, 2015). Colors indicate read counts from high (red) to low (blue). Most of the mitochondrial transcripts identified in DAVID enrichment set have reduced expression in the PW-UPD + ASD group compared to all other groups.

