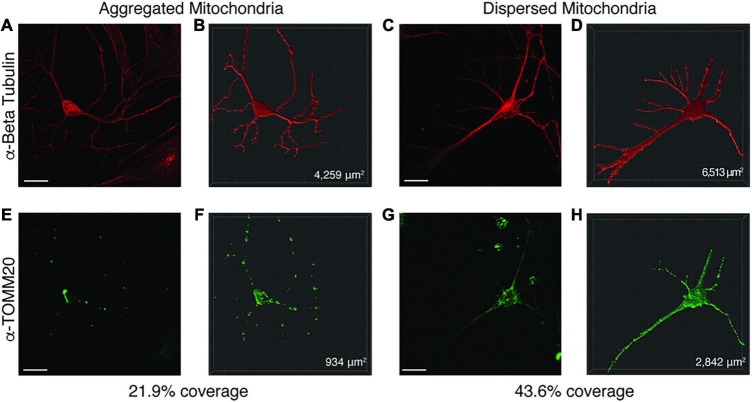
FIGURE 6.
Representative image of Imaris volumetric analysis. Z stacks from neuronal images taken on a Zeiss 810 confocal microscope were loaded into the Imaris software suite for analysis. (A,E) show a representative image of a neuron with mitochondrial aggregates while (C,G) depict a neuron with dispersed mitochondria. Anti-Beta Tubulin (A,C) was used to measure the surface area of the neuron, while anti-TOMM20 (E,G) was used to label total mitochondria content within the neuron. Using the surfaces function in Imaris, a mask for the Beta Tubulin (B,D) and TOMM20 (F,H) stained areas was constructed. From these surface masks, the area is calculated by the software (bottom right corner of B,D,F,H) for each surface. The mitochondrial area within the neuron was divided by the total neuronal area to determine a percentage of mitochondrial volume. Images were taken at 63× by confocal microscopy. Scale bar represents 20 μM.

