
TABLE 3.
Lipid composition of the ECM of planktonically- and biofilm-grown Mabs NJH12.
| Structures | Theoretical mass (m/z) | Biofilm | Planktonic | Charge | Observed mass (m/z) | Mass accuracy (ppm) |
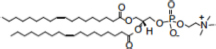
DOPC
|
844.6073 | + | + | [M+Hac-H]– | 844.6095 | 2.58 |
|
| ||||||
| Free fatty acids | 253.2173 (C16:1) | + | + | [M-H]– | 253.2175 | 0.67 |
| Palmitoleic acid (C16:1), Palmitic acid (C16:0) | 255.2329 (C16:0) | + | + | [M-H]– | 255.2322 | –2.74 |
| Oleic acid (C18:1), Stearic acid (C18:0) | 281.2486 (C18:1) | + | + | [M-H]– | 281.2471 | –5.33 |
| 283.2642(C18:0) | + | + | [M-H]– | 283.2657 | 5.30 | |
|
| ||||||
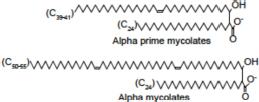
Free mycolic acids
|
913.9321 | + | nd | [M-H]– | 913.9374 | 5.76 |
| 927.9478 | t | – | [M-H]– | 927.9495 | 1.83 | |
| 941.9634 | + | + | [M-H]– | 941.9632 | –0.27 | |
| 1080.1040 | + | – | [M-H]– | 1080.1071 | 2.86 | |
| 1108.1354 | + | t | [M-H]– | 1108.1313 | –3.65 | |
| 1122.1511 | + | t | [M-H]– | 1122.1491 | –1.76 | |
| 1136.1668 | + | t | [M-H]– | 1136.1641 | –2.34 | |
| 1150.1825 | + | t | [M-H]– | 1150.1812 | –1.08 | |
| 1164.1982 | t | + | [M-H]– | 1164.1892 | –7.68 | |
|
| ||||||
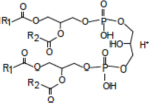
Cardiolipins
|
1265.8543 (2R1 + 2R2 = 58:2) | + | + | [M-H]+ | 1265.8517 | –2.01 |
| 1279.8699 (2R1 + 2R2 = 59:2) | + | + | [M-H]+ | 1279.8629 | –5.46 | |
| 1293.8856 (2R1 + 2R2 = 60:2) | + | + | [M-H]+ | 1293.8959 | 7.99 | |
| 1307.9012 (2R1 + 2R2 = 61:2) | + | + | [M-H]+ | 1307.8983 | –2.22 | |
| 1321.9169 (2R1 + 2R2 = 62:2) | + | + | [M-H]+ | 1321.9147 | –1.62 | |
| 1335.9325 (2R1 + 2R2 = 63:2) | + | + | [M-H]+ | 1335.9302 | –1.74 | |
| 1349.9482 (2R1 + 2R2 = 64:2) | + | + | [M-H]+ | 1349.9412 | –5.16 | |
| 1363.9638 (2R1 + 2R2 = 65:2) | + | + | [M-H]+ | 1363.9522 | –8.48 | |
| 1377.9795 (2R1 + 2R2 = 66:2) | + | + | [M-H]+ | 1377.9729 | –4.77 | |
|
| ||||||
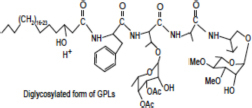
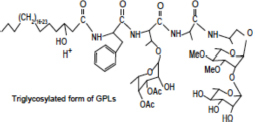
Glycopeptidolipids (GPLs)
|
1207.7939 | + | + | [M-H]+ | 1207.7970 | 2.58 |
| 1221.8096 | + | + | [M-H]+ | 1221.8110 | 1.19 | |
| 1235.8253 | + | + | [M-H]+ | 1235.8347 | 7.66 | |
| 1249.8410 | + | + | [M-H]+ | 1249.8458 | 3.86 | |
| 1263.8567 | + | + | [M-H]+ | 1263.8620 | 4.18 | |
| 1277.8724 | + | + | [M-H]+ | 1277.8756 | 2.51 | |
| 1291.8881 | + | + | [M-H]+ | 1291.8879 | –0.10 | |
| 1305.9038 | + | – | [M-H]+ | 1305.9042 | 0.29 | |
|
| ||||||
|
1353.8518 | + | + | [M-H]+ | 1353.8574 | 4.16 |
| 1367.8677 | + | + | [M-H]+ | 1367.8632 | –3.28 | |
| 1381.8834 | + | + | [M-H]+ | 1381.8844 | 0.74 | |
| 1395.8991 | + | + | [M-H]+ | 1395.9031 | 2.89 | |
| 1409.9148 | + | + | [M-H]+ | 1409.9119 | 2.04 | |
| 1423.9305 | + | + | [M-H]+ | 1423.9345 | 2.84 | |
|
| ||||||
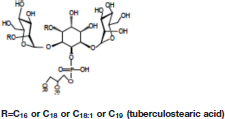
Ac2PIM2
|
1622.0835 | t | – | [M-H]– | 1622.0758 | –2.75 |
| 1636.0992 | t | – | [M-H]– | 1636.1103 | 6.81 | |
| 1648.0992 | t | – | [M-H]– | 1648.0992 | 0.01 | |
| 1650.1148 | t | – | [M-H]– | 1650.1112 | –2.19 | |
| 1662.1148 | t | – | [M-H]– | 1662.1222 | 4.45 | |
LC-MS analyses were run in both positive and negative modes and the m/z values of the main compounds identified are shown. Plus and minuses refer to the presence or absence of detectable amounts of lipid constituents. t denotes ions present at trace levels (counts < 100).