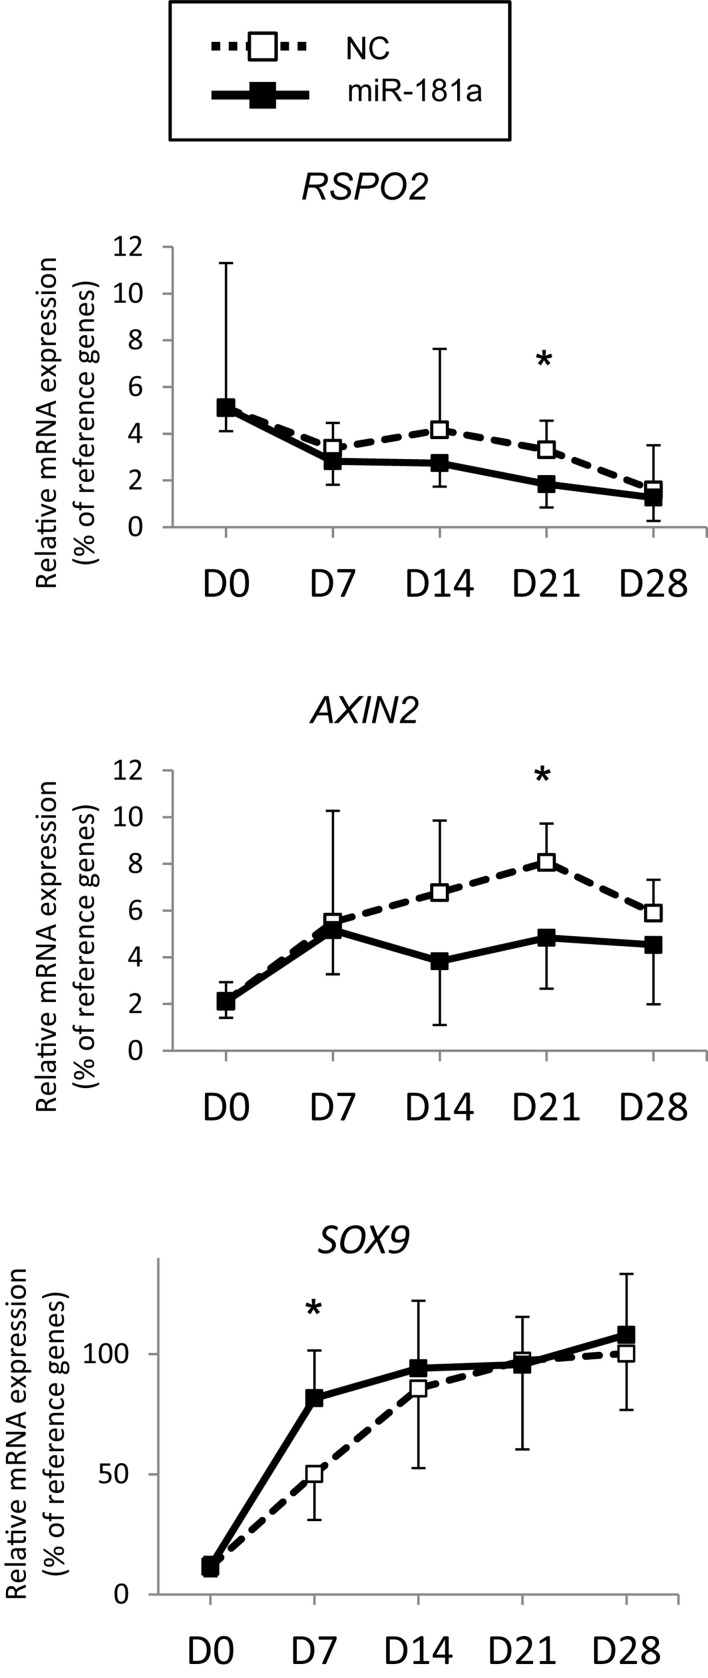
FIGURE 3.
MSC (N = 5–6 donors) were transfected with miR-181a (black line, black squares), or with a control non-targeting miR (NC, black dotted line, white squares) mimic at day 0, then subjected to chondrogenic differentiation for 28 days, and mRNA expression for indicated genes was monitored at indicated time points by qRT-PCR. Levels of mRNA expression were normalized to a geomean of HPRT, CPSF6 and RPL13. Error bars correspond to mean values ± SD; *p ≤ 0.05, NC vs miR-181a at indicated time points (Mann–Whitney U).

