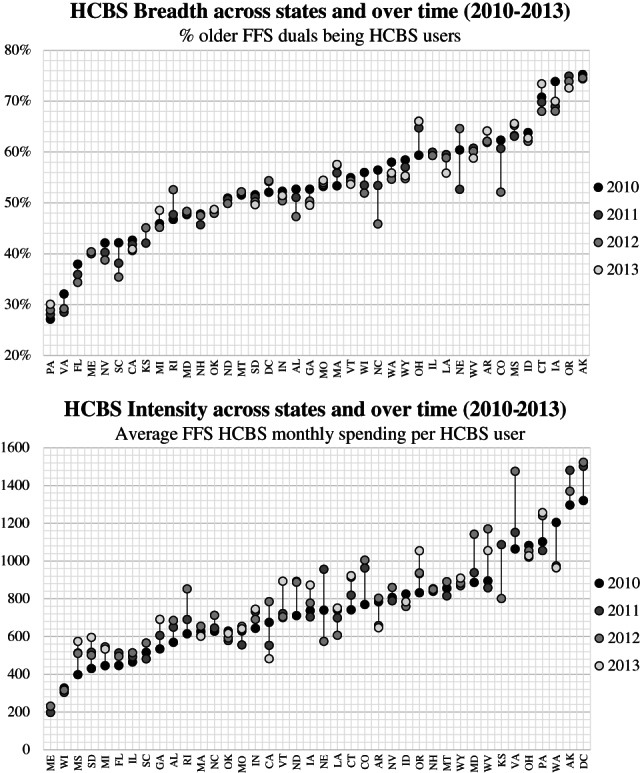
FIGURE 1.

Cross‐state and over‐time variation in Medicaid home‐ and community‐based services (HCBS) breadth and intensity. Eleven states (AZ, DE, HI, KY, MN, NJ, NM, NY, TN, TX, UT) were excluded from this figure due to high penetration of managed care program enrollment or major expansion of managed care programs during study period
