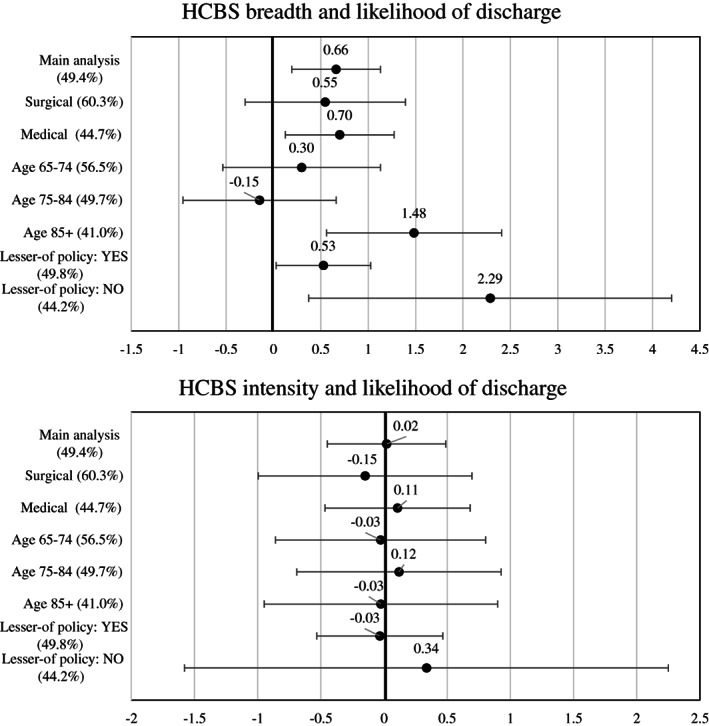
FIGURE 2.

Findings from main analysis and stratified analysis: relationship between Medicaid home‐ and community‐based services (HCBS) breadth/intensity and likelihood of community discharge by day 100. Each line in the figure indicates estimated probability and 95% confidence interval, and the percentage in the parentheses after the model name indicates the mean predicted probability of discharge from the model. Unit for HCBS breadth is 10 percentage points, unit for HCBS intensity is $100, and unit of outcome is 1 percentage point. Eleven states (AZ, DE, HI, KY, MN, NJ, NM, NY, TN, TX, UT) were excluded from this analysis. The full results are presented in the Appendix
